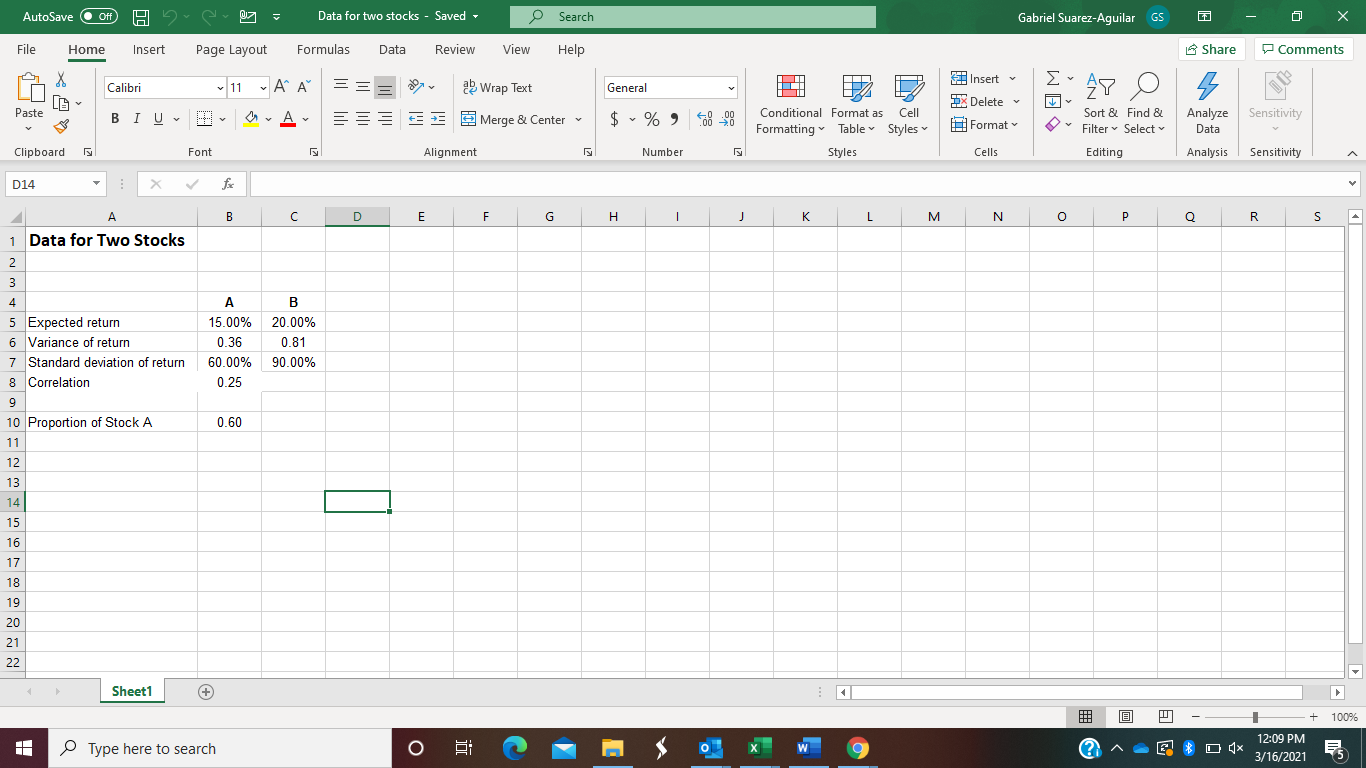
Use the Excel file Data and screenshot for Two Stocks to determine the following (Solve with Excel): a. Create a two-way data table that determines
Use the Excel file Data and screenshot for Two Stocks to determine the following (Solve with Excel):
a. Create a two-way data table that determines the standard deviations for portfolios consisting of combinations of Stock A and Stock B by varying the correlation coefficient value between Stock A and Stock B through the full range of possible correlation coefficient values. Use increments of 0.25 for the possible correlation coefficient values. Vary the proportion invested in Stock A from 0 to 1.00 in increments of 0.20.
b. What does this table indicate about the impact of the correlation coefficient on a portfolios risk?

AutoSave Off Have Data for two stocks Saved - O Search Gabriel Suarez-Aguilar GS File Home Insert Page Layout Formulas Data Review View Help Share Comments Insert Calibri 11AA == General 47 a Wrap Text - 3 Merge & Center s Analyze Sensitivity Data Paste BIU 2X Delete Format A y $ %, 820 Conditional Format as Cell Formatting Table Styles Styles v Sort & Find & Filter Select Editing Clipboard Font Alignment Number Cells Analysis Sensitivity D14 X B D E F G H H 1 J j K L M N o Q R S A 1 Data for Two Stocks 2 3 4 5 Expected return 6 Variance of return 7 Standard deviation of return 8 Correlation 9 10 Proportion of Stock A 11 A B 15.00% 20.00% 0.36 0.81 60.00% 90.00% 0.25 0.60 12 13 14 15 16 17 18 19 20 21 22 Sheet1 + + 100% Type here to search o > 2 E o 12:09 PM 3/16/2021 AutoSave Off Have Data for two stocks Saved - O Search Gabriel Suarez-Aguilar GS File Home Insert Page Layout Formulas Data Review View Help Share Comments Insert Calibri 11AA == General 47 a Wrap Text - 3 Merge & Center s Analyze Sensitivity Data Paste BIU 2X Delete Format A y $ %, 820 Conditional Format as Cell Formatting Table Styles Styles v Sort & Find & Filter Select Editing Clipboard Font Alignment Number Cells Analysis Sensitivity D14 X B D E F G H H 1 J j K L M N o Q R S A 1 Data for Two Stocks 2 3 4 5 Expected return 6 Variance of return 7 Standard deviation of return 8 Correlation 9 10 Proportion of Stock A 11 A B 15.00% 20.00% 0.36 0.81 60.00% 90.00% 0.25 0.60 12 13 14 15 16 17 18 19 20 21 22 Sheet1 + + 100% Type here to search o > 2 E o 12:09 PM 3/16/2021
Step by Step Solution
There are 3 Steps involved in it
Step: 1

See step-by-step solutions with expert insights and AI powered tools for academic success
Step: 2

Step: 3

Ace Your Homework with AI
Get the answers you need in no time with our AI-driven, step-by-step assistance
Get Started


