

Question
Use the figure for the question(s) below. This graph depicts the payoffs of: This graph depicts the payoffs of: A. a long position in a
Use the figure for the question(s) below. This graph depicts the payoffs of:
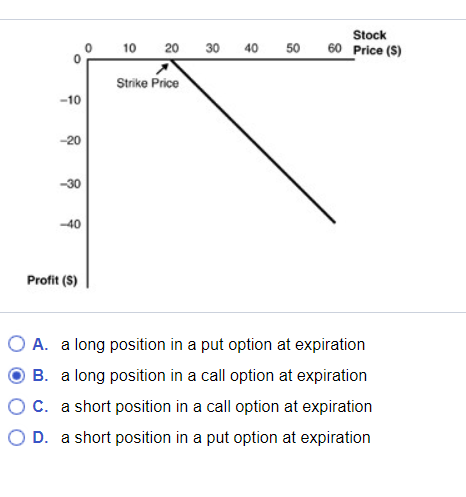
This graph depicts the payoffs of:
A. a long position in a put option at expiration
B. a long position in a call option at expiration
C. a short position in a call option at expiration
D. a short position in a put option at expiration
0 10 20 30 40 50 Stock 60 Price (s) Strike Price -10 -20 -30 -40 Profit (S) O A. a long position in a put option at expiration B. a long position in a call option at expiration C. a short position in a call option at expiration OD. a short position in a put option at expirationStep by Step Solution
There are 3 Steps involved in it
Step: 1

Get Instant Access to Expert-Tailored Solutions
See step-by-step solutions with expert insights and AI powered tools for academic success
Step: 2

Step: 3
Ace Your Homework with AI
Get the answers you need in no time with our AI-driven, step-by-step assistance
Get Started
Finance And Economics Discussion Series The Evolution Of The Demand For Temporary Help Supply Employment In The United States
Authors: United States Federal Reserve Board, Marcello Estevao, Saul Lach
1st Edition
1288717881, 9781288717880