Answered step by step
Verified Expert Solution
Question
1 Approved Answer
Use the financial statements and the information provided below to answer the questions that follow. Mammoth Mart Stores, Inc. (S000,000s) Year 1 Year 2 Sales
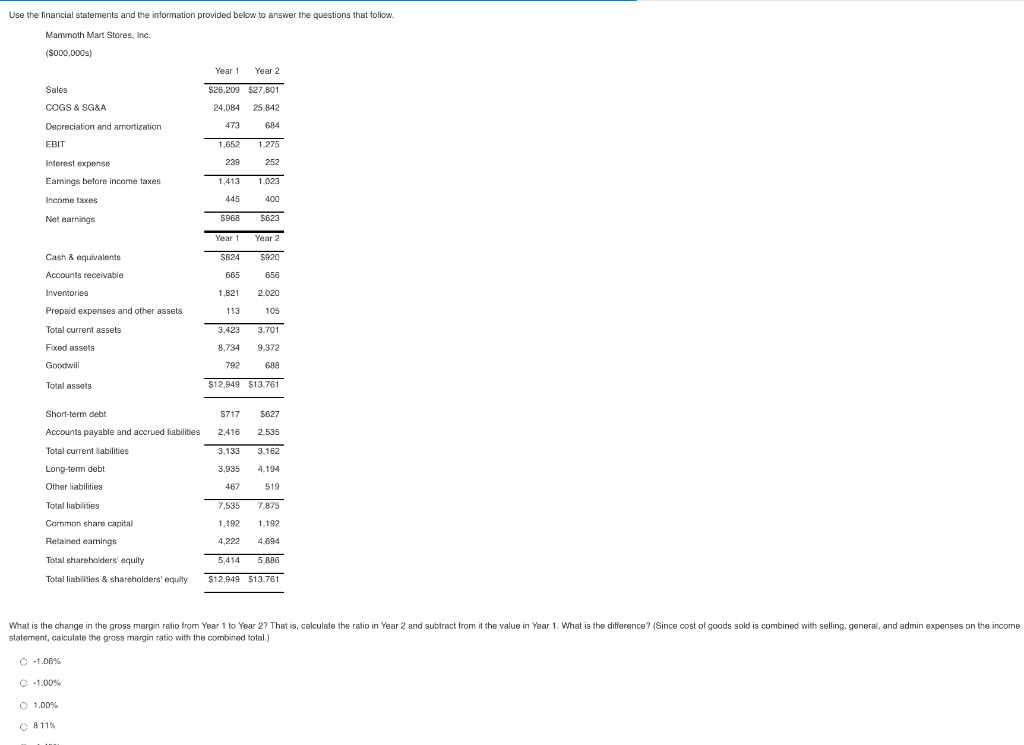
Use the financial statements and the information provided below to answer the questions that follow. Mammoth Mart Stores, Inc. (S000,000s) Year 1 Year 2 Sales $26,209 $27 801 24.084 25 842 COGS & SG&A 473 684 Depreciation and amortization EBIT 1,652 1 275 239 252 Interest expense Earnings before income taxes 1,413 1.023 Income taxes 445 400 Net earnings S968 $622 Year 1 Year 2 SB24 $920 Cash & equivalents Accounts receivable Inventories 665 658 1,821 2020 Prepaid expenses and other assets 113 105 Total current assets 3,423 3.701 Fixed assets 9,372 8,734 792 Goodwill fa Total assets $12,949 $13,761 S717 $627 Short-term debt Accounts payable and accrued liabilities 2,416 2.535 3,133 3.162 Total current liabilities Long-term debt Other liabilities 3,935 4.194 467 519 7,535 7.875 1,192 1.192 Total liabilities Common share capital Retained earnings Total shareholders equity Total liabilities & shareholders' equity 4.222 4.694 5,414 5.886 $12,949 $13.761 What is the change in the gross margin ratio from Year 1 to Year 2? That is, calculate the ratio in Year 2 and subtract from it the value in Year 1. What is the difference? (Since cost of goods sold is combined with selling, general, and admin expenses on the income statement, calculate the gross margin ratio with the combined total) 0 -1.08% O -1.00% O 1.00% O 8 11%
Step by Step Solution
There are 3 Steps involved in it
Step: 1
Get Instant Access to Expert-Tailored Solutions
See step-by-step solutions with expert insights and AI powered tools for academic success
Step: 2
Step: 3
Ace Your Homework with AI
Get the answers you need in no time with our AI-driven, step-by-step assistance
Get Started