

Question
Use the financial statements below Analyze the info below 1. Calculate the current ratio, net profit margin, and after-tax ROE for the company you chose,
Use the financial statements below
Analyze the info below
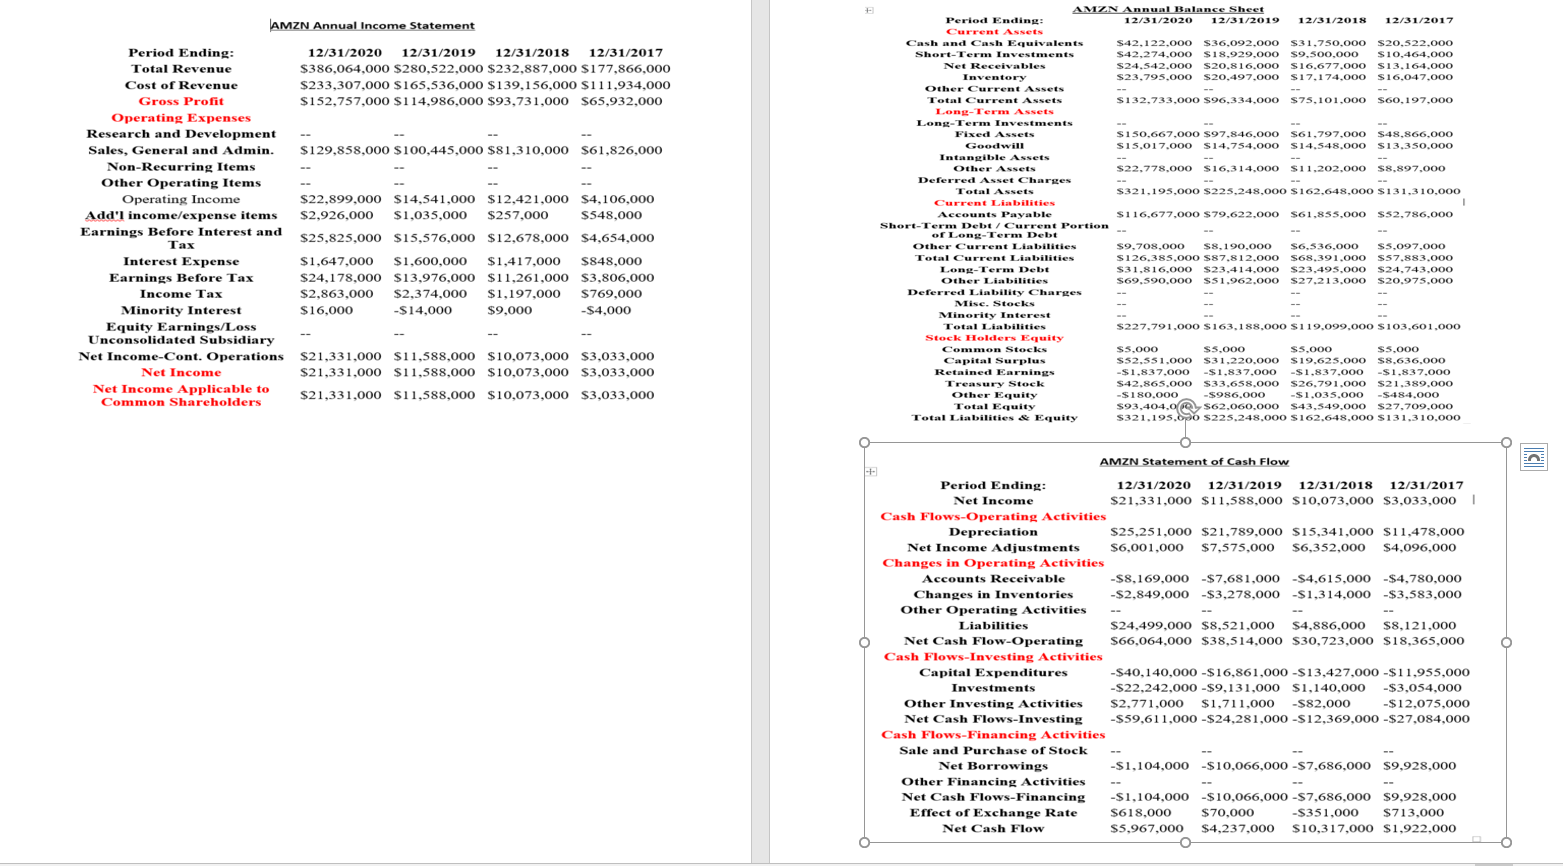
1. Calculate the current ratio, net profit margin, and after-tax ROE for the company you chose, and then explain whether these ratios are favorable or unfavorable.
2. Provide an opinion of Amazons financial condition using the above financial ratios calculated in question 1
3. Explain the uses for each of the three classifications of ratios: liquidity, solvency, and profitability.
4. Display your calculations.
+ AMZN Annual Income Statement Period Ending: 12/31/2020 12/31/2019 12/31/2018 12/31/2017 Total Revenue $386,064,000 $280,522,000 $232,887,000 $177,866,000 Cost of Revenue $233,307,000 $165,536,000 $139,156,000 $111,934,000 Gross Profit $152,757,000 $114,986,000 $93,731,000 $65,932,000 $$ Operating Expenses Research and Development Sales, General and Admin. $129,858,000 $100,445,000 $81,310,000 $61,826,000 Non-Recurring Items Other Operating Items Operating Income $22,899,000 $14,541,000 $12,421,000 $4,106,000 Add'l income/expense items $2,926,000 $1,035,000 $257,000 $548,000 Earnings Before Interest and $25,825,000 $15,576,000 $12,678,000 $4,654,000 Tax Interest Expense $1,647.000 $1,600,000 $1,417,000 $848,000 Earnings Before Tax $24,178,000 $13,976,000 $11,261,000 $3,806,000 Income Tax $2,863,000 $2,374,000 $1,197,000 $769,000 Minority Interest $16,000 -$14,000 $9,000 -$4,000 Equity Earnings/Loss Unconsolidated Subsidiary Net Income-Cont. Operations $21,331,000 $11,588,000 $10,073,000 $3,033,000 Net Income $21,331,000 $11,588,000 $10,073,000 $3,033,000 Net Income Applicable to Common Shareholders $21,331,000 $11,588,000 $10,073,000 $3,033,000 AMZN Annual Balance Sheet Period Ending: 12/31/2020 12/31/2019 12/31/2018 12/31/2017 Current Assets Cash and Cash Equivalents $42,122.000 $36.092.000 $31,750,000 $20,522.000 Short-Term Investments S42,274,000 $18,929,000 $9,500,000 $10.464.000 Net Receivables S24.542.000 $20,816,000 $16,677.000 $13.164.000 Inventory S23,795,000 $20,497.000 $17,174,000 $16,047.000 Other Current Assets Total Current Assets $132.733,000 $96.334.000 $75,101.000 S60,197.000 Long-Term Assets Long-Term Investments Fixed Assets S150,667,000 $97,846,000 $61,797.000 $48.866.000 Goodwill SI5.01 7.000 $14.754.000 $14.548.000 $13,350.000 Intangible Assets Other Assets S22,778,000 $16,314.000 $11,202,000 $8,897.000 Deferred Asset Charges Total Assets S321,195,000 $225,248,000 S162.648,000 $131,310,000 Current Liabilities 1 Accounts Payable S116,677,000 $79,622,000 $61,855,000 $52,786,000 Short-Term Debt / Current Portion of Long-Term Debt Other Current Liabilities $9,708.000 $8.190.000 $6,536.000 S5,097.000 Total Current Liabilities S126.385.000 587.812.000 S68.391.000 S57.883.000 Long-Term Debt S31,816,000 $23,414,000 S23,495,000 S24,743,000 Other Liabilities S69.590.000 S51,962.000 $27.213.000 $20,975.000 Deferred Liability Charges Misc. Stocks Minority Interest Total Liabilities S227.791,000 $163,188,000 $119.099,000 $103.601,000 Stock Holders Equity Common Stocks S5.000 S5,000 S5,000 S5,000 Capital Surplus S52.551.000 531,220,000 $19.625,000 $8,636.000 Retained Earnings -$1.837.000 -$1.837.000 -$1.837.000 -$1.837.000 Treasury Stock S42,865,000 $33,658.000 26.791,000 $21.389.000 Other Equity -$180,000 -$986,000 -$1.035.000 -$48.000 Total Equity 393,404,00 , S62,060,000 $43,549,000 $27,709,000 Total Liabilities & Equity S321,195.So s225.248.000 S162,648.000 $131,310.000 AMZN Statement of Cash Flow O Period Ending: 12/31/2020 12/31/2019 12/31/2018 12/31/2017 Net Income $21,331,000 $11,588,000 $10,073,000 $3,033,000 1 Cash Flows-Operating Activities Depreciation $25,251,000 $21,789,000 $15,341,000 $11,478,000 Net Income Adjustments $6,001,000 $7,575,000 $6,352,000 $4,096,000 Changes in Operating Activities Accounts Receivable -$8,169,000 $7,681,000 $4,615,000 $4,780,000 Changes in Inventories -$2,849,000 $3,278,000 $1,314,000 $3,583,000 Other Operating Activities Liabilities $24.499,000 $8,521,000 $4,886,000 $8,121.000 Net Cash Flow-Operating S66,064,000 $38,514,000 $30,723,000 $18,365,000 Cash Flows-Investing Activities Capital Expenditures -$40,140,000 - $16,861,000-$13,427,000-$11,955,000 Investments -$22,242,000-$9,131,000 $1,140,000 -$3,054,000 Other Investing Activities $2,771,000 $1,711,000 $82,000 -$12,075,000 Net Cash Flows-Investing -$59,611,000 - $24,281,000-$12,369,000-$27,084,000 Cash Flows-Financing Activities Sale and Purchase of Stock Net Borrowings -$1,104,000 $10,066,000-7,686,000 $9,928,000 Other Financing Activities Net Cash Flows-Financing -$1,104,000 $10,066,000-$7,686,000 $9,928,000 Effect of Exchange Rate S618.000 $70,000 -S351,000 $713,000 Net Cash Flow $5,967,000 $4,237,000 $4,237,000 $10,317,000 $1,922,000Step by Step Solution
There are 3 Steps involved in it
Step: 1

Get Instant Access to Expert-Tailored Solutions
See step-by-step solutions with expert insights and AI powered tools for academic success
Step: 2

Step: 3
Ace Your Homework with AI
Get the answers you need in no time with our AI-driven, step-by-step assistance
Get Started
Real Estate Investment Strategies Structures Decisions
Authors: David Hartzell, Andrew E. Baum
2nd Edition
1119526094, 978-1119526094