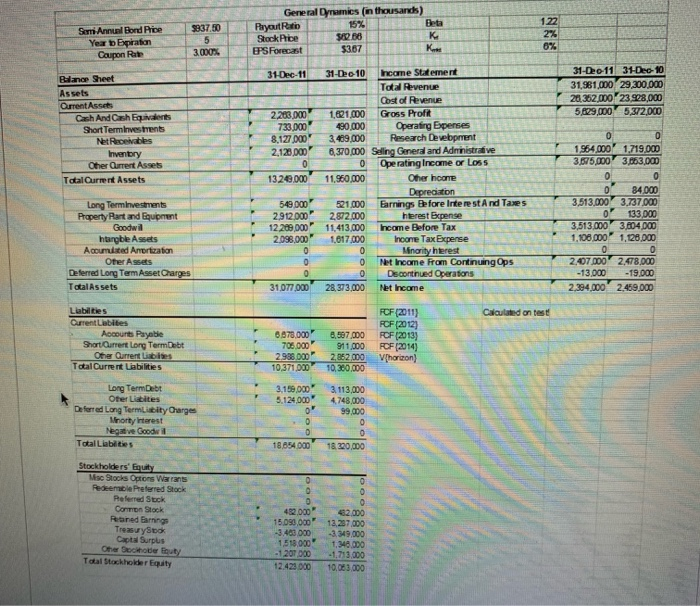
Use the financial statements below to calculate the weighted average cost of capital(WACC) for general dynamics in 2001. be sure to show your work, as partial credit will be given. also, if you get stuck on a part of the WACC, just assume a value for it when asked to calculate your final result instead of leaving it blank.
1. what is the cost of debt for general dynamics at the end of 2011?
2. using the book values for your firm, what is the weight of debt for genetal dynamics at the end of 2011?
3. what was general dhnamics effective tax rate in 2011?
4. using the capital asset pricing model(CAPM), what is the cost of equity for general dynamics in 2011?
5. given the precious values you calculated, what is the WACC for general dynamics?
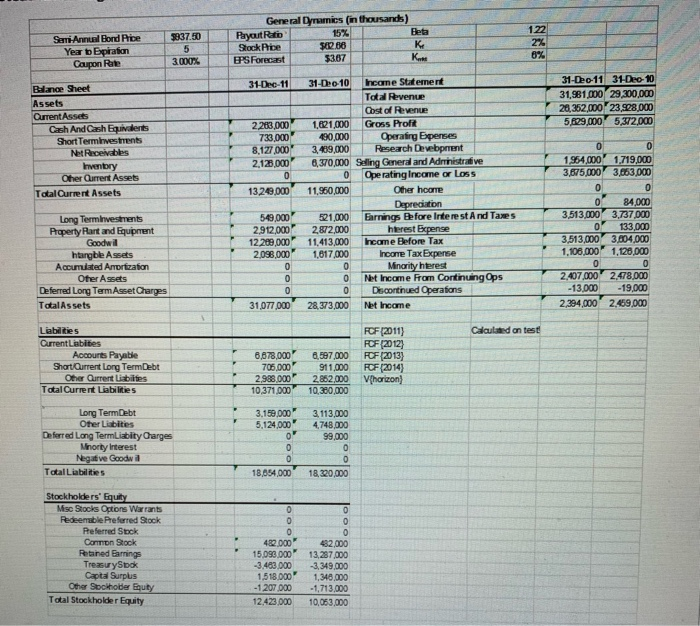
Sem Annual Bond Price Year Epration Coupon Rate $837.50 5 3.000% General Dynamics (in thousands) Payout Ratio 15% Stock Price 88 PPS Forecast $3.67 SRS 3 10ec-11 31-D20 11 31-Dec-10 31,961,000 29,300,000 20,362,000 23,928,000 5,829,000 5,372,000 Be Sheet Assets Current Assets Cash And Cash Egives Short Terminvestments NetReceivables Inventory Cher Qurrent Assets TotalCurrent Assets 2 2 283.000 733,000 8,127000 2,128.000 0 1328.000 31-Dec 10 Income Statement Total Revenue Cost of Revenue 1,821,000 Gross Profit 490,000 Operating Expenses 3.489,000 Research Devebprent 6,370,000 Seling General and Administrative 0 Operating Income or loss 11.960,000 O ther home wincome Depreciaton 21.000 Earnings Before Interest And Taxes 2.872.000 herest Expense 11,413.000 Income Before Tax 1,617.000 noone Tax Expense Minority terest Net Income from Continuing Ops Discontinued Operations 28,373.000 Net Income 1,964,000 1,719,000 3,675,000 3.683.000 00 0 84.000 3,513,000 3.737.000 0 133 000 3,513.000 3.604000 1,100,000 1,128,000 549.000 2912.000 12209,000 2.098,000 Long Terminvestments Property Part and Equipment Goodwill hargble Assets Accumulated Anortization ter Assets Deferred Long Term Asset Charges Total Assets 2,407.000 -13,000 2.394.000 2.478.000 -19.000 2.459.000 31.077,000 Calculated on test Llabilities QurrentLabites Accounts Payable Short Current Long Term Debt Other Current Lisbites Total Current Labilities 6.878,000 705.000 2.988.000 10,371,000 8,507.000 911,000 2,852.000 10,380.000 FOF (2011) FCF (2012) FCF (2013) FCF (2014) Vhorizon) 3.199.000 5.124,000' 01 3.113,000 4748,000 99 000 Long Term Debt Ofer Latites Deferred Long Termlicity Charges Minorty interest Negative Goodwill Total Liabilities Stockholders' Equity Misc Stocks Optons Warrants Redeemable Preferred Stock Peferred Suck Common Stock Runed Garnings Treasury Stok Captal Surpus Other Decktober outy Total Stockholder Equity 12,287,000 15.090,000" -3.400.000 1,518,000 -1207 000 12.428000 383750 Sami Annu Blondice Year Expration Cagon Rate General Dynamics (in thousands) Payout Rito 15% Sock Price $22.68 US Forecast 3367 3000% 31-Dec-11 31-Dec-10 31-Dec-11 31-Dec-10 31,981.000 29,300,000 26,352,000 23,908,000 5829,000 5372.000 Balance Sheet Assets Current Assets Cash And Cash Events Short Terminvestments NetReceivables Intory Oher Current Assets Total Current Assets 2283.000 733.000 8,177.000 2,128,000 0 1328.000 1.621,000 60.000 3469,000 6,370,000 0 11,960,000 1,719,000 3,663,000 hane Statement Total Revenue Cost of Revenue Gross Profit Operating Expenses Research Devebrunt Selling General and Administrative Operating Income or Loss Oher hoone Deprecation Earnings Before Interest And Taxes rest Expense Income Before Tax Income Tax Expense Minority herest Net Income From Continuing Ops Dortnued Operations Net Income Long Terminvestments Property Part and Equipment Goodwil hargble Assets Accumulated Anortation Other Assets Deferred Long Term Asset Charges TotalAssets 1,954,000 3,675,000 0 0 3,513,000 0 3,513,000 1,108,000 549,000 2912,000 12 289,000 2,098,000 521,000 2,872,000 11,413,000 1,617.000 84000 3,737.000 133.000 3,604,000 1,128,000 2.407.000 -13,000 2,394,000 2.478.000 - 19.000 2,459,000 31,077.000 28,373,000 C ladon test Liabilities CurrentLisbites Acourts Payable Short Current Long Term Debt Other Current Lisbites Total Current Liabilities 6,678,000 705.000 2,988.000 10,371.000 4,597,000 911,000 2.862,000 10,300,000 FCF (2011) FCF (2012) POF (2013) FCF (2014) V horizon 3.159.000 5,124.000 Long Term Debt Other cities Deferred Long Term Liabity Charges Minorty interest Negative Goodud Total Liabilities 3.113.000 4748.000 99,000 18,654.000 18.220.000 Stockholders' Eu Mise Soci Otons Warrants Redeemable Preferred Stock Preferred Sock Common Stock Retired Barnings Treasury Sook Capt Surplus Other Sockholder Euty Total Stockholder Equity 482.000 15.090.000 -3.483.000 1.518.000 -1 207.000 12.423.000 432,000 13.257.000 1.349.000 1.340.000 - 1,713,000 10.053.000


