Answered step by step
Verified Expert Solution
Question
1 Approved Answer
USE THE FOLLOWING DATA TO ANSWER QUESTIONS 35 40 Annual Income Statements 2018 2017 525,800 Sales 559,700 ???? 149,600 COGS Gross profit 381,000 410,100 250,100
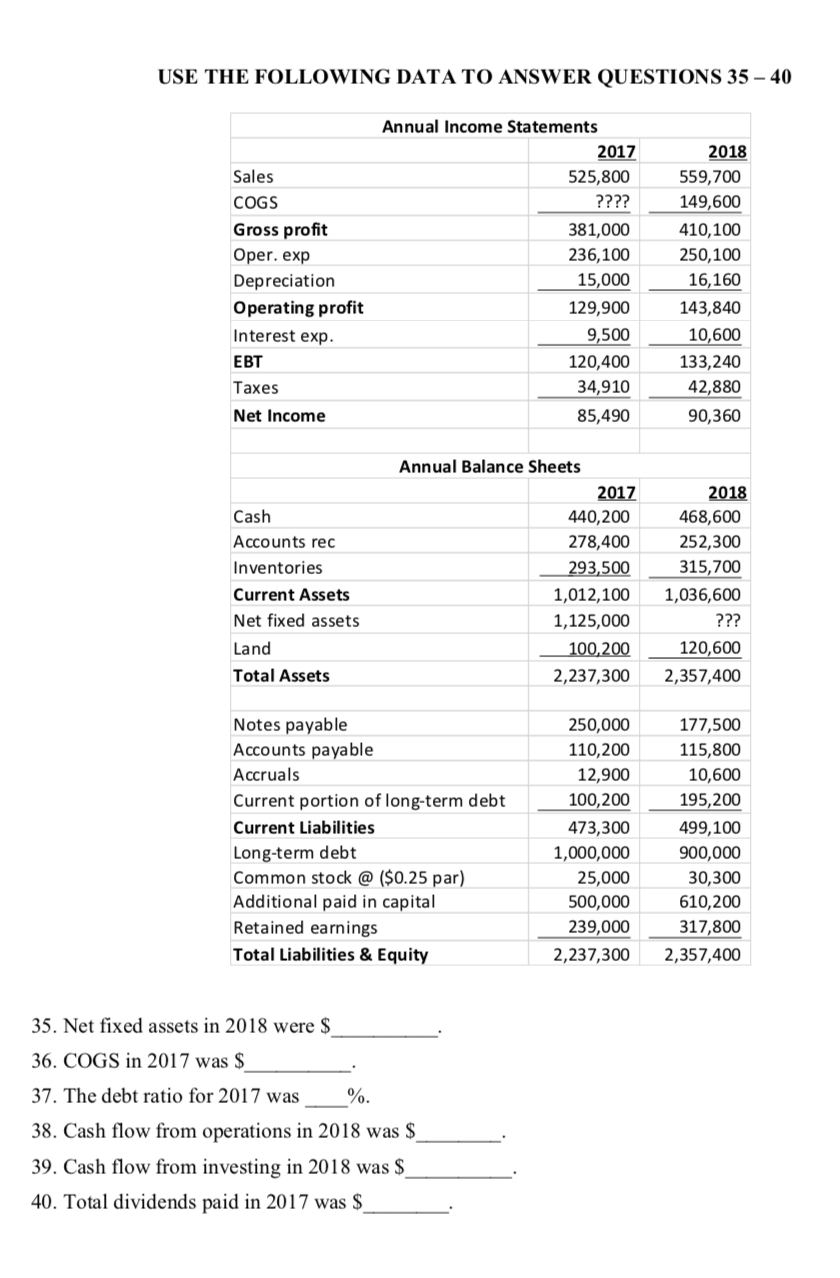
USE THE FOLLOWING DATA TO ANSWER QUESTIONS 35 40 Annual Income Statements 2018 2017 525,800 Sales 559,700 ???? 149,600 COGS Gross profit 381,000 410,100 250,100 per. exp 236,100 15,000 16,160 Depreciation Operating profit 129,900 143,840 Interest exp. 9,500 10,600 133,240 T 120,400 42,880 34,910 Taxes 90,360 Net Income 85,490 Annual Balance Sheets 2017 440,200 2018 Cash 468,600 252,300 Accounts rec 278,400 315,700 Inventories 293,500 Current Assets 1,012,100 1,036,600 Net fixed assets ??? 1,125,000 100,200 120,600 Land Total Assets 2,237,300 2,357,400 Notes payable Accounts payable 177,500 250,000 110,200 115,800 Accruals 12,900 10,600 Current portion of long-term debt 100,200 195,200 499,100 900,000 Current Liabilities 473,300 Long-term debt Common stock @ ($0.25 par) Additional paid in capital Retained earnings 1,000,000 25,000 30,300 610,200 500,000 317,800 239,000 Total Liabilities & Equity 2,357,400 2,237,300 35. Net fixed assets in 2018 were $ 36. COGS in 2017 was $ 37. The debt ratio for 2017 was %. 38. Cash flow from operations in 2018 was $ 39. Cash flow from investing in 2018 was $ 40. Total dividends paid in 2017 was $
Step by Step Solution
There are 3 Steps involved in it
Step: 1
Get Instant Access to Expert-Tailored Solutions
See step-by-step solutions with expert insights and AI powered tools for academic success
Step: 2
Step: 3
Ace Your Homework with AI
Get the answers you need in no time with our AI-driven, step-by-step assistance
Get Started