Answered step by step
Verified Expert Solution
Question
1 Approved Answer
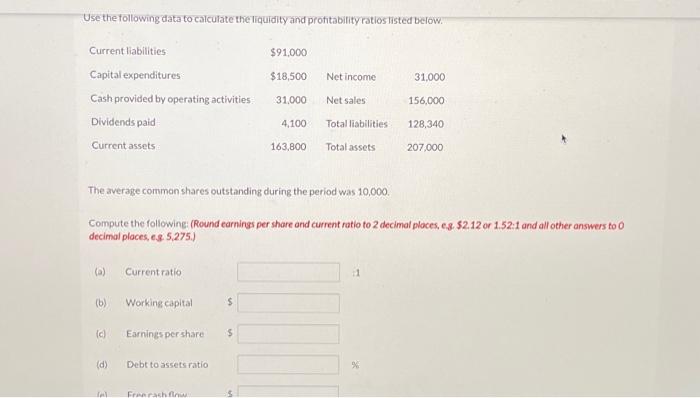
Use the following data to calculate the liquidity and profitability ratios listed below. Current liabilities Capital expenditures Cash provided by operating activities Dividends paid

Use the following data to calculate the liquidity and profitability ratios listed below. Current liabilities Capital expenditures Cash provided by operating activities Dividends paid Current assets (a) Current ratio (b) (c) (d) (al Working capital Earnings per share Debt to assets ratio The average common shares outstanding during the period was 10,000. Compute the following: (Round earnings per share and current ratio to 2 decimal places, e.g. $2.12 or 1.52:1 and all other answers to 0 decimal places, e.g. 5,275.) Free rash flow $ $91,000 $18,500 31,000 $ 4,100 163,800 Net income Net sales Total liabilities Total assets 31,000 156,000 128,340 % 207,000
Step by Step Solution
There are 3 Steps involved in it
Step: 1
Lets calculate the requested ratios a Current Ratio Current Ratio Current Assets Current Liabili...
Get Instant Access to Expert-Tailored Solutions
See step-by-step solutions with expert insights and AI powered tools for academic success
Step: 2

Step: 3

Ace Your Homework with AI
Get the answers you need in no time with our AI-driven, step-by-step assistance
Get Started


