

Answered step by step
Verified Expert Solution
Question
1 Approved Answer
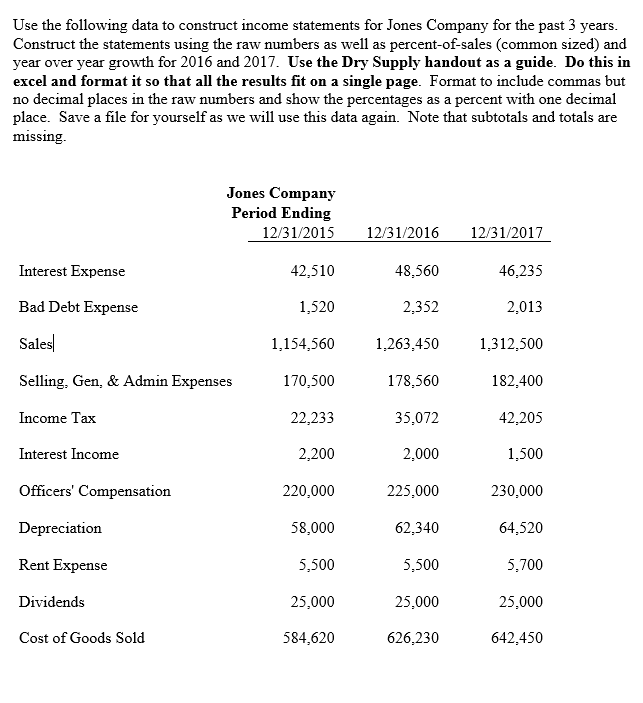
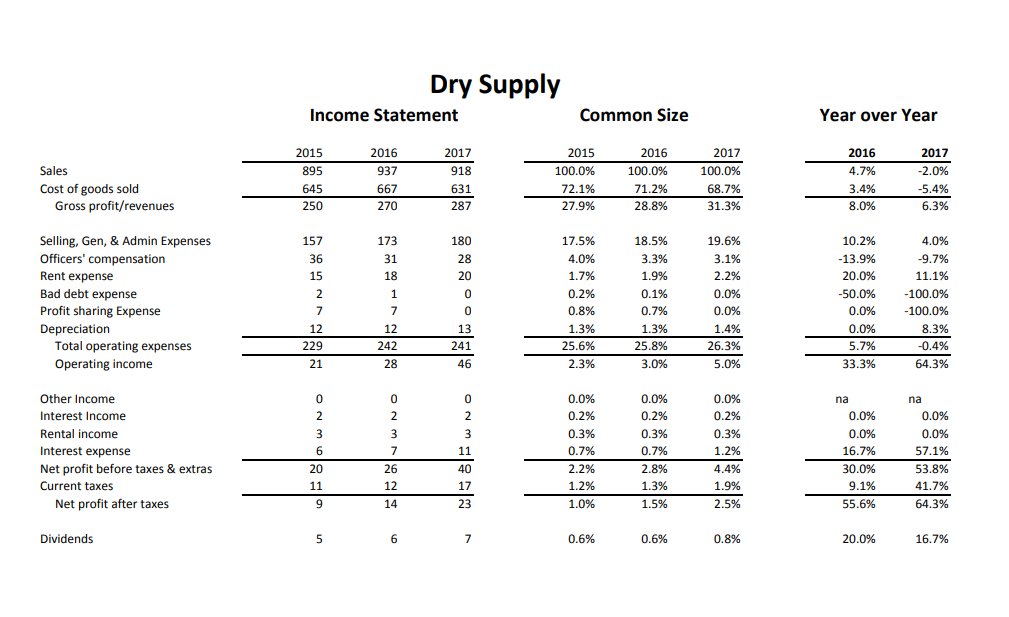
Use the following data to construct income statements for Jones Company for the past 3 years. Construct the statements using the raw numbers as well
Step by Step Solution
There are 3 Steps involved in it
Step: 1

Get Instant Access to Expert-Tailored Solutions
See step-by-step solutions with expert insights and AI powered tools for academic success
Step: 2

Step: 3
Ace Your Homework with AI
Get the answers you need in no time with our AI-driven, step-by-step assistance
Get Started
Financial Literacy And Money Script A Caribbean Perspective
Authors: Christine Sahadeo
1st Edition
3319770748, 978-3319770741