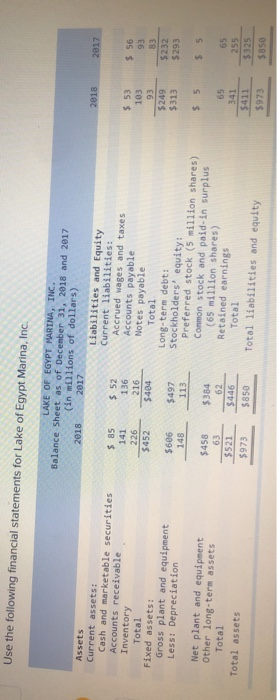
Use the following financial statements for Lake of Egypt Marina, Inc. 2018 2017 Assets Current assets: Cash and marketable securities Accounts receivable Inventory Total Fixed assets: Gross plant and equipment Less: Depreciation LAKE OF EGYPT MARINA, INC. Balance Sheet as of December 31, 2018 and 2017 2018 2017 (in millions of dollars) Liabilities and Equity Current liabilities: $ 85 $ 52 Accrued wages and taxes 141 136 Accounts payable 226 216 Notes payable $452 5484 Total Long-term debt: $606 $497 Stockholders' equity: 148 113 Preferred stock (5 million shares) Common stock and paid-in surplus $458 $384 (65 million shares) 63 62 Retained earnings $521 $446 Total $973 $850 Total liabilities and equity $ 53 103 93 $249 $313 $ 56 93 83 $ 232 $293 $ 5 $ 5 Net plant and equipment Other long-term assets Total Total assets 65 341 $411 $973 65 255 $325 $850 LAKE OF EGYPT MARINA, INC. Income Statement for Years Ending December 31, 2018 and 2017 (in millions of dollars) 2018 $ 645 295 350 43 2017 $ 562 240 $ 322 38 $ ped ok nt 284 33 251 43 208 68 140 $ $ Net sales (all credit) Less: Cost of goods sold Gross profits Less: Other operating expenses Earnings before interest, taxes, depreciation, and amortization (EBITDA) Less: Depreciation Earnings before interest and taxes (EBIT) Less: Interest Earnings before taxes (EBT) Less: Taxes Net income Less: Preferred stock dividends Net income available to common stockholders Less: Common stock dividends Addition to retained earnings Per (common) share data: Earnings per share (EPS) Dividends per share (DPS) Book value per share (BVPS) Market value (price) per share (MVPS) 307 35 272 46 $ 226 70 $ 156 $ 5 $ 151 65 $ 86 nces $ $ 5 $ 135 65 $ 70 $2.323 $1.000 $6.246 $15.40 $2.077 $1.000 $4.923 $13.20 Calculate the internal and sustainable growth rate for Lake of Egypt Marina, Inc. (Do not round intermediate calculations. Round your answers to 2 decimal places.) % Intemal growth rate Sustainable growth rate