Answered step by step
Verified Expert Solution
Question
1 Approved Answer
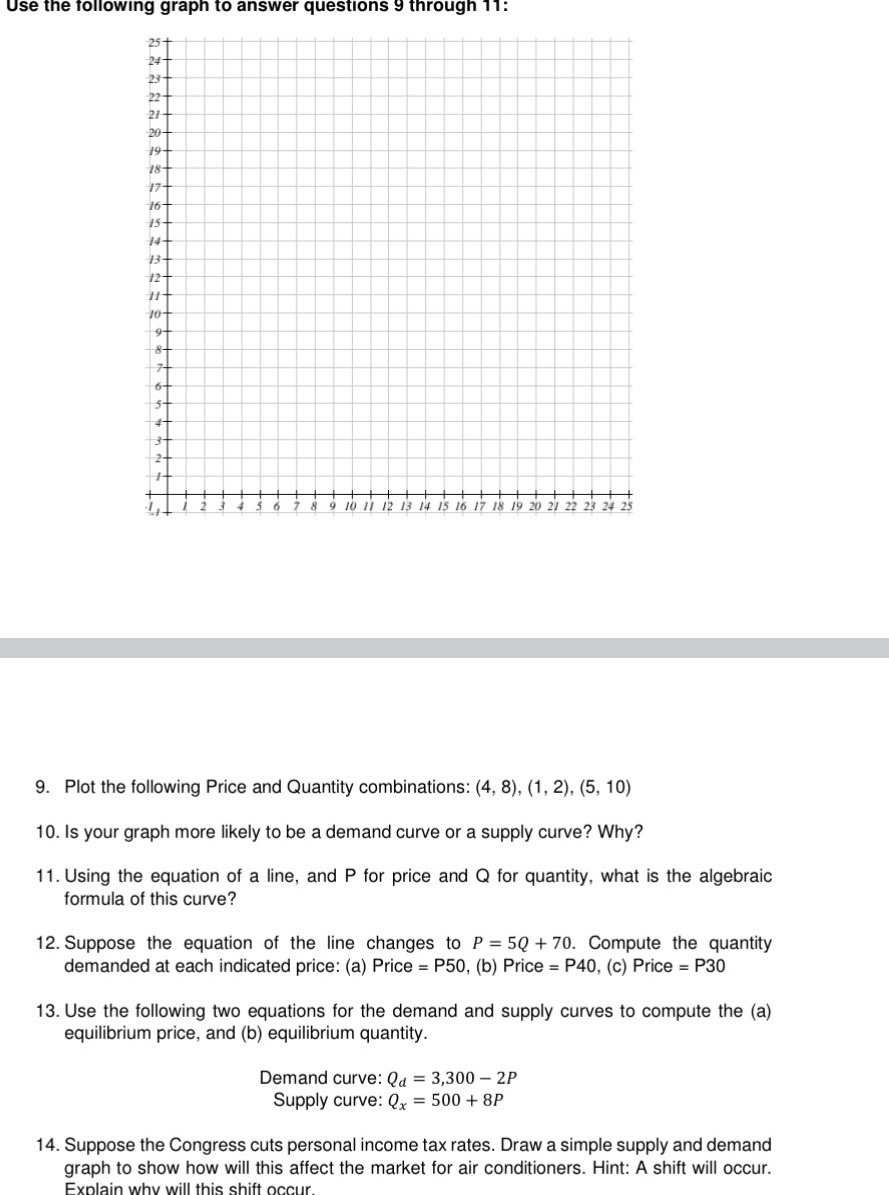
Use the following graph to answer questions 9 through 11: 25+ 24- 23+ 22- 21- 20- 19+ 18+ 17+ 16- 15+ 14 13- 12-

Use the following graph to answer questions 9 through 11: 25+ 24- 23+ 22- 21- 20- 19+ 18+ 17+ 16- 15+ 14 13- 12- 10+ 9+ 8+ 7+ 6+ #+ 3+ 6 7 8 9 10 11 12 13 14 15 16 17 18 19 20 21 22 23 24 25 9. Plot the following Price and Quantity combinations: (4, 8), (1, 2), (5, 10) 10. Is your graph more likely to be a demand curve or a supply curve? Why? 11. Using the equation of a line, and P for price and Q for quantity, what is the algebraic formula of this curve? 12. Suppose the equation of the line changes to P=5Q+70. Compute the quantity demanded at each indicated price: (a) Price = P50, (b) Price = P40, (c) Price = P30 13. Use the following two equations for the demand and supply curves to compute the (a) equilibrium price, and (b) equilibrium quantity. Demand curve: Q = 3,300 - 2P Supply curve: Qx = 500 + 8P 14. Suppose the Congress cuts personal income tax rates. Draw a simple supply and demand graph to show how will this affect the market for air conditioners. Hint: A shift will occur. Explain why will this shift occur.
Step by Step Solution
There are 3 Steps involved in it
Step: 1

Get Instant Access to Expert-Tailored Solutions
See step-by-step solutions with expert insights and AI powered tools for academic success
Step: 2

Step: 3

Ace Your Homework with AI
Get the answers you need in no time with our AI-driven, step-by-step assistance
Get Started


