

Answered step by step
Verified Expert Solution
Question
1 Approved Answer
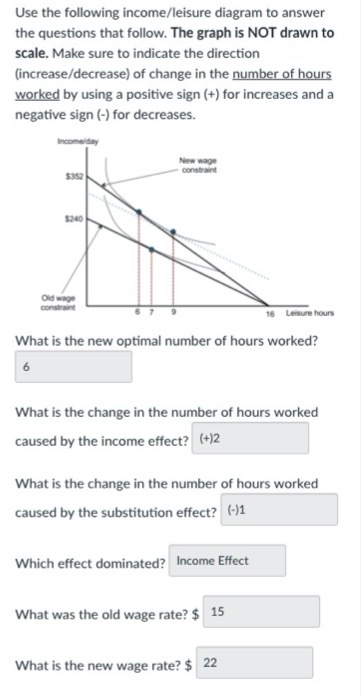
Use the following income/leisure diagram to answer the questions that follow. The graph is NOT drawn to scale. Make sure to indicate the direction (increase/decrease)
Step by Step Solution
There are 3 Steps involved in it
Step: 1

Get Instant Access to Expert-Tailored Solutions
See step-by-step solutions with expert insights and AI powered tools for academic success
Step: 2

Step: 3
Ace Your Homework with AI
Get the answers you need in no time with our AI-driven, step-by-step assistance
Get Started
Intermediate Microeconomics and Its Application
Authors: walter nicholson, christopher snyder
11th edition
9781111784300, 324599102, 1111784302, 978-0324599107