Answered step by step
Verified Expert Solution
Link Copied!

Question

1 Approved Answer

Use the following information for problems 26 through 29. R&D engineers for a car manufacturer wanted to test the relationship between a cars speed x
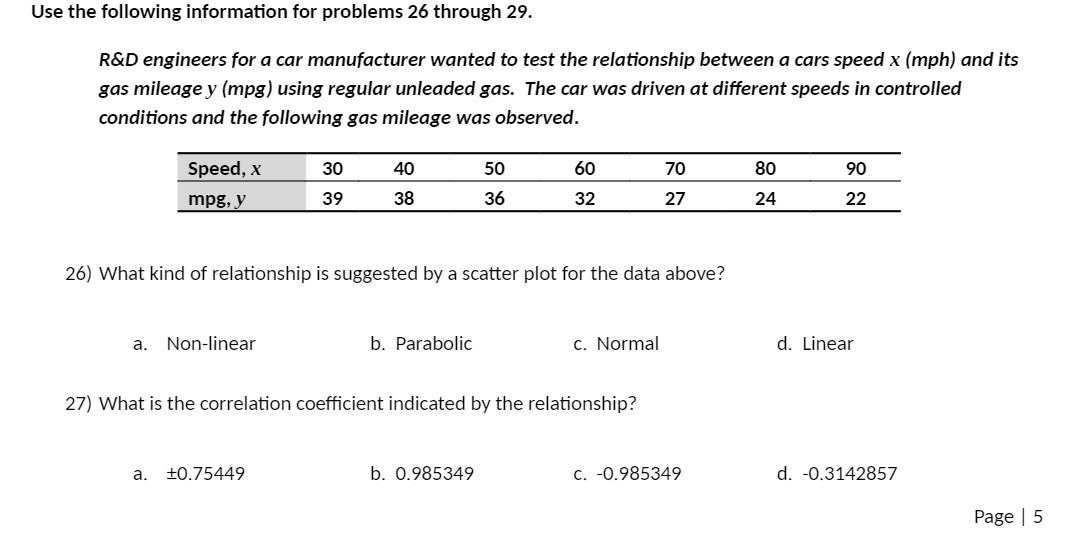
image text in transcribed
Use the following information for problems 26 through 29. R&D engineers for a car manufacturer wanted to test the relationship between a cars speed x [mph] and its gas mileage y (mpg) using regular unleaded gas. The car was driven at different speeds in controlled conditions and the following gas miieage was observed. Speed, x 30 4O 5O 60 70 80 mpg, y 39 38 36 32 27 24 26) What kind of relationship is suggested by a scatter plot for the data above? a. Nonlinear b. Parabolic c. Normal 27) What is the correlation coefcient indicated by the relationship? a. 17544? b. 0.985349 c. {3.985349 90 22 d. Linear d. 0.3142857 Page | 5

Step by Step Solution

There are 3 Steps involved in it

Step: 1

blur-text-image

Get Instant Access to Expert-Tailored Solutions

See step-by-step solutions with expert insights and AI powered tools for academic success

Step: 2

blur-text-image_2

Step: 3

blur-text-image_3

Ace Your Homework with AI

Get the answers you need in no time with our AI-driven, step-by-step assistance

Get Started

Recommended Textbook for

Derivatives Markets

Authors: Robert McDonald

3rd Edition

978-9332536746, 9789332536746

Students also viewed these Mathematics questions

Question

=+and economic growth? Is corruption always bad?

Answered: 1 week ago

Question

What is are four types of ARTS?

Answered: 1 week ago

Question

What is multiple outcomes design? Explain.

Answered: 1 week ago