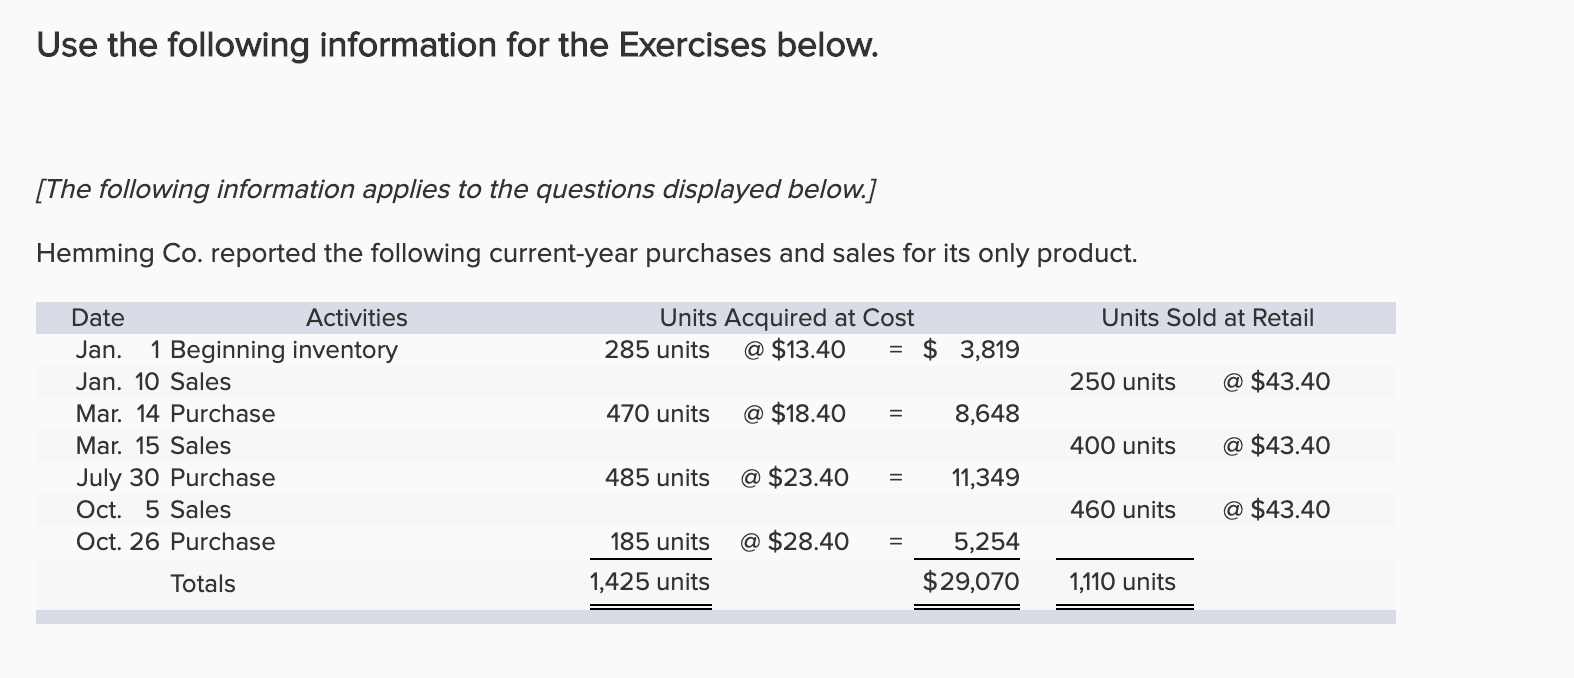

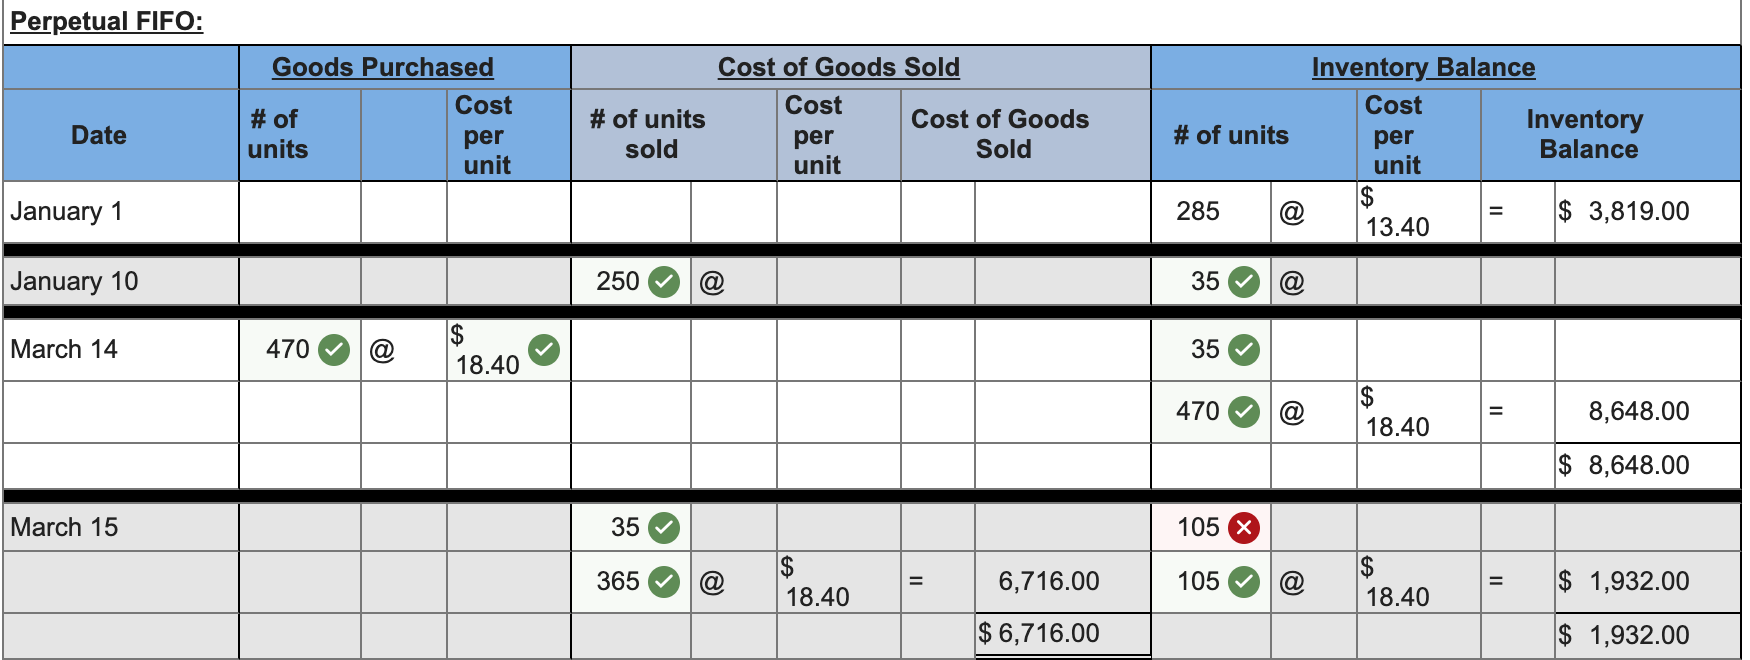
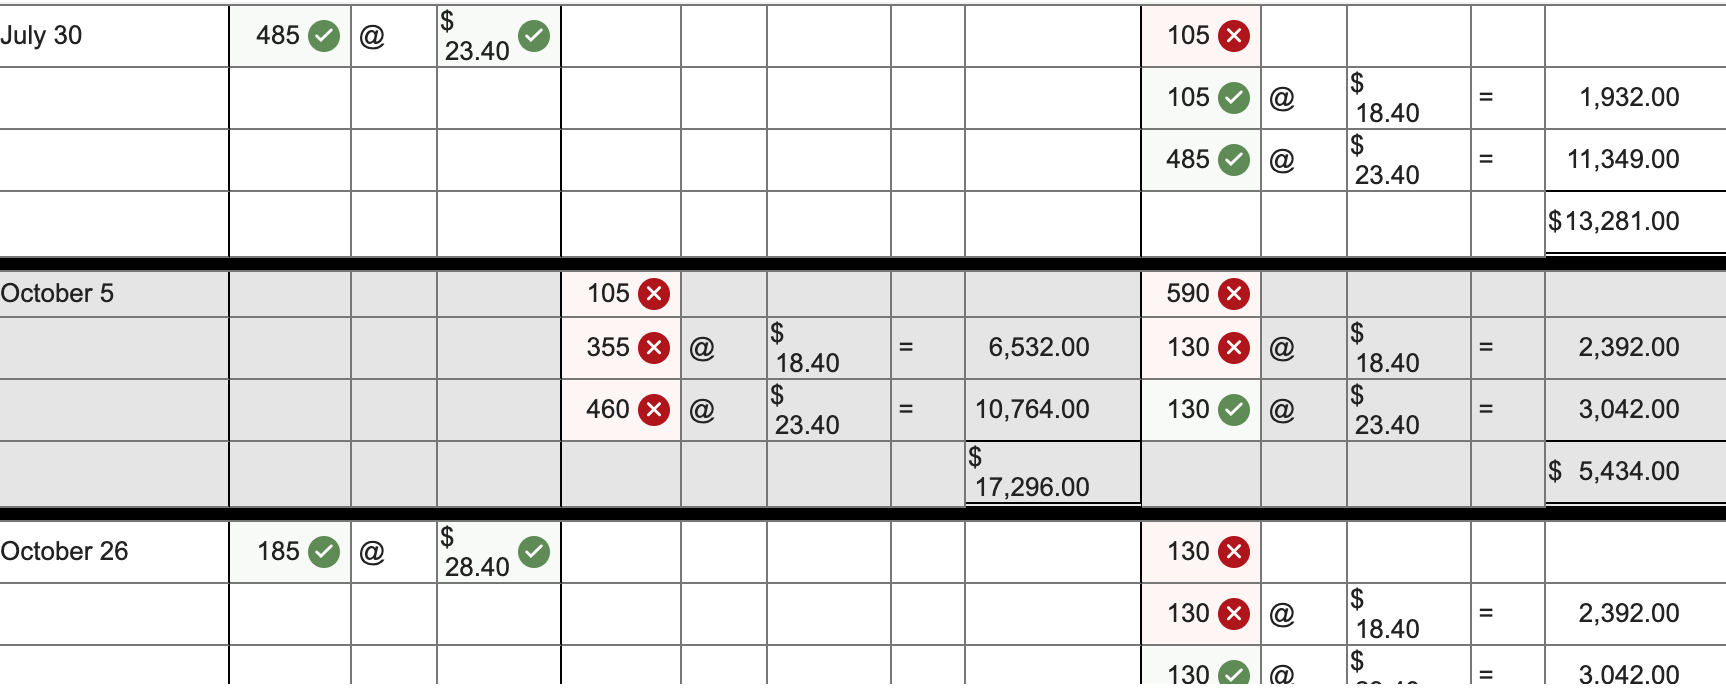
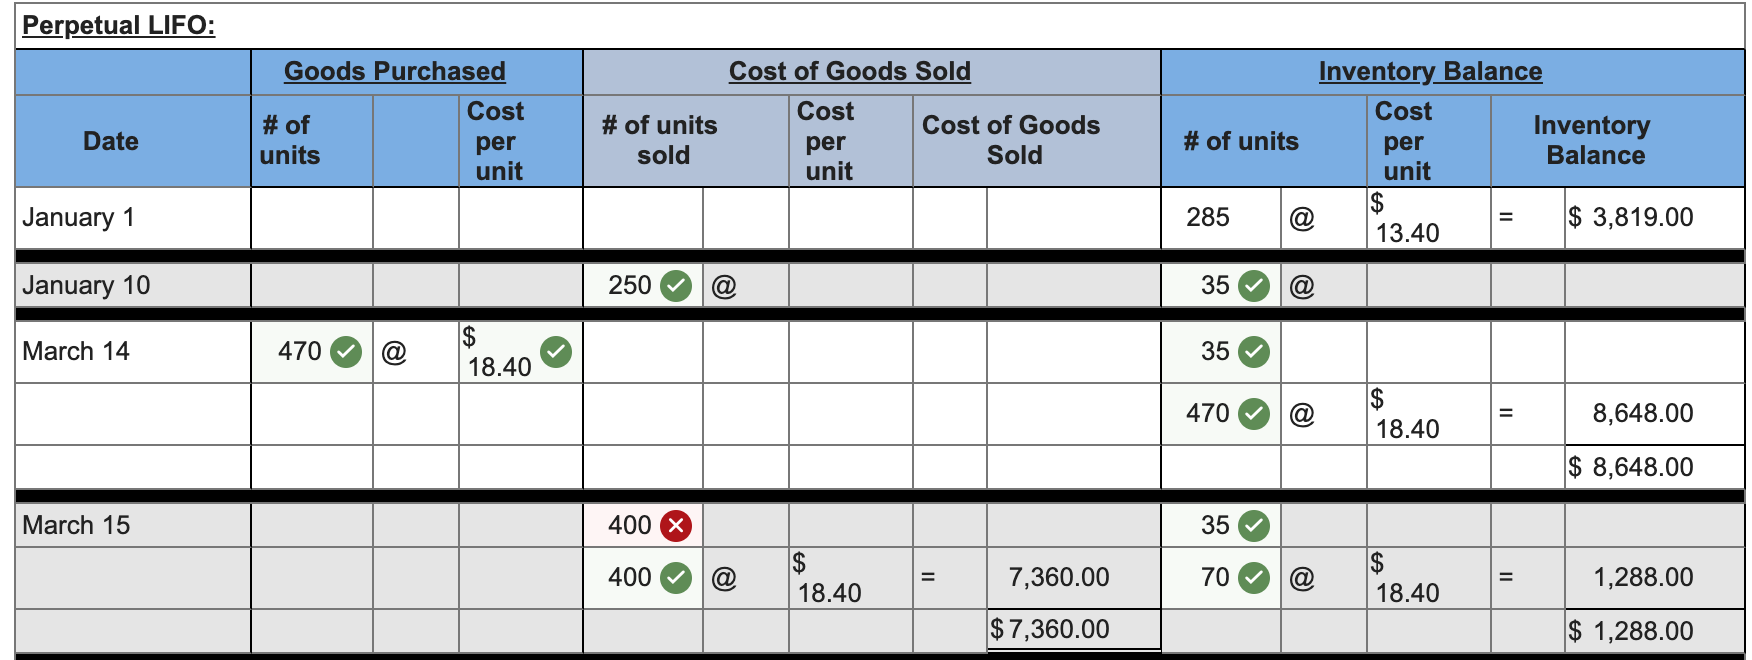
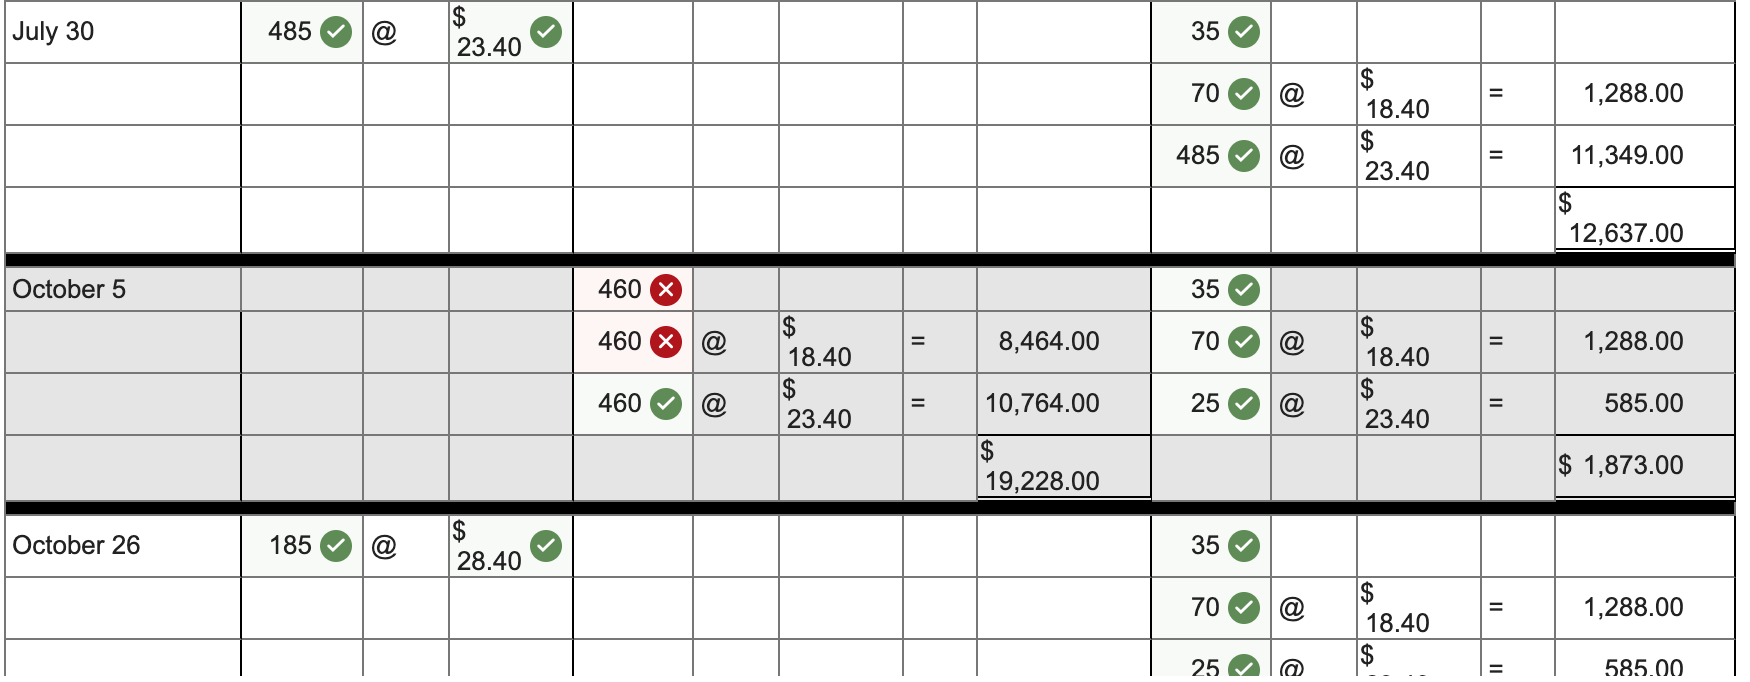
Use the following information for the Exercises below. [The following information applies to the questions displayed below.] Hemming Co. reported the following current-year purchases and sales for its only product. Units Sold at Retail Units Acquired at Cost 285 units @ $13.40 $ 3,819 250 units @ $43.40 470 units @ $18.40 8,648 Date Activities Jan. 1 Beginning inventory Jan. 10 Sales Mar. 14 Purchase Mar. 15 Sales July 30 Purchase Oct. 5 Sales Oct. 26 Purchase 400 units @ $43.40 485 units @ $23.40 11,349 460 units @ $43.40 185 units @ $28.40 5,254 $29,070 Totals 1,425 units 1,110 units Required: Hemming uses a perpetual inventory system. 1. Determine the costs assigned to ending inventory and to cost of goods sold using FIFO. 2. Determine the costs assigned to ending inventory and to cost of goods sold using LIFO. 3. Compute the gross margin for FIFO method and LIFO method. Perpetual FIFO: Goods Purchased Cost # of units per unit Cost of Goods Sold Cost # of units Cost of Goods sold per Sold unit Date Inventory Balance Cost # of units Inventory per Balance unit $ 285 a $ 3,819.00 13.40 January 1 January 10 250 @ 35 A March 14 470 a 35 18.40 470 $ 18.40 8,648.00 $ 8,648.00 March 15 35 105 365 @ $ 18.40 = 6,716.00 105 $ 18.40 II $ 1,932.00 $ 6,716.00 $ 1,932.00 July 30 485 a $ 23.40 105 $ 105 @ 1,932.00 18.40 485 11,349.00 23.40 $ 13,281.00 October 5 105 X 590 x 355 X a 6,532.00 130 x a 2,392.00 $ 18.40 $ 23.40 $ 18.40 $ 23.40 460 X @ Il 10,764.00 130 II 3,042.00 $ 5,434.00 17,296.00 October 26 185 a $ 28.40 130 x 130 X @ II 2,392.00 $ 18.40 $ 130 .. 3.042.00 Perpetual LIFO: Goods Purchased Cost of Goods Sold Date # of units Cost per unit # of units sold Cost per unit Cost of Goods Sold Inventory Balance Cost Inventory # of units per Balance unit $ 285 @ $ 3,819.00 13.40 January 1 January 10 250 @ 35 March 14 470 35 18.40 470 $ 18.40 8,648.00 $ 8,648.00 March 15 400 35 400 @ $ 18.40 = 7,360.00 70 a $ 18.40 1,288.00 $ 7,360.00 $ 1,288.00 July 30 485 35 23.40 70 @ 1,288.00 $ 18.40 $ 23.40 485 11,349.00 12,637.00 October 5 460 X 35 460 X @ = 8,464.00 70 @ 1,288.00 18.40 $ 18.40 $ 23.40 460 a = 10,764.00 25 585.00 23.40 $ 19,228.00 $ 1,873.00 October 26 185 $ 28.40 35 70 @ 1,288.00 $ 18.40 $ 25 585.00


