

Answered step by step
Verified Expert Solution
Question
1 Approved Answer
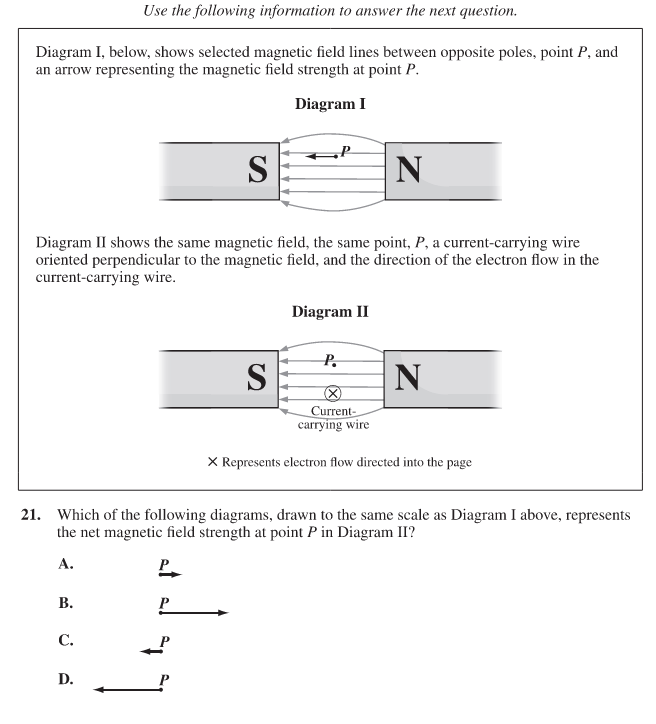
Use the following information to answer the next question. Diagram I, below, shows selected magnetic field lines between opposite poles, point P, and an arrow

Step by Step Solution
There are 3 Steps involved in it
Step: 1

Get Instant Access to Expert-Tailored Solutions
See step-by-step solutions with expert insights and AI powered tools for academic success
Step: 2

Step: 3
Ace Your Homework with AI
Get the answers you need in no time with our AI-driven, step-by-step assistance
Get Started
Design And Analysis Of Experiments Vol. 1
Authors: Klaus Hinkelmann
1st Edition
0471727563, 9780471727569