Use the following information to calculate the NPV for the project:
Tucker Hansson pored over a proposal developed by his firms manufacturing team. It called for investing $50 million to expand production capacity at Hansson Private Label (Hansson or HPL). For Hansson, a private company, this would be a significant investment. The company had not initiated a project of that magnitude for more than a decade, and the expansion wasnt without significant risk. It would be likely to double HPLs debt and to greatly increase customer concentration. This was a critical juncture for the firm Tucker Hansson had carefully built over 15 years. He wondered whether the return on investment would be large enough to justify the effort and risk. He also wondered about the best means of evaluating the potential investment.
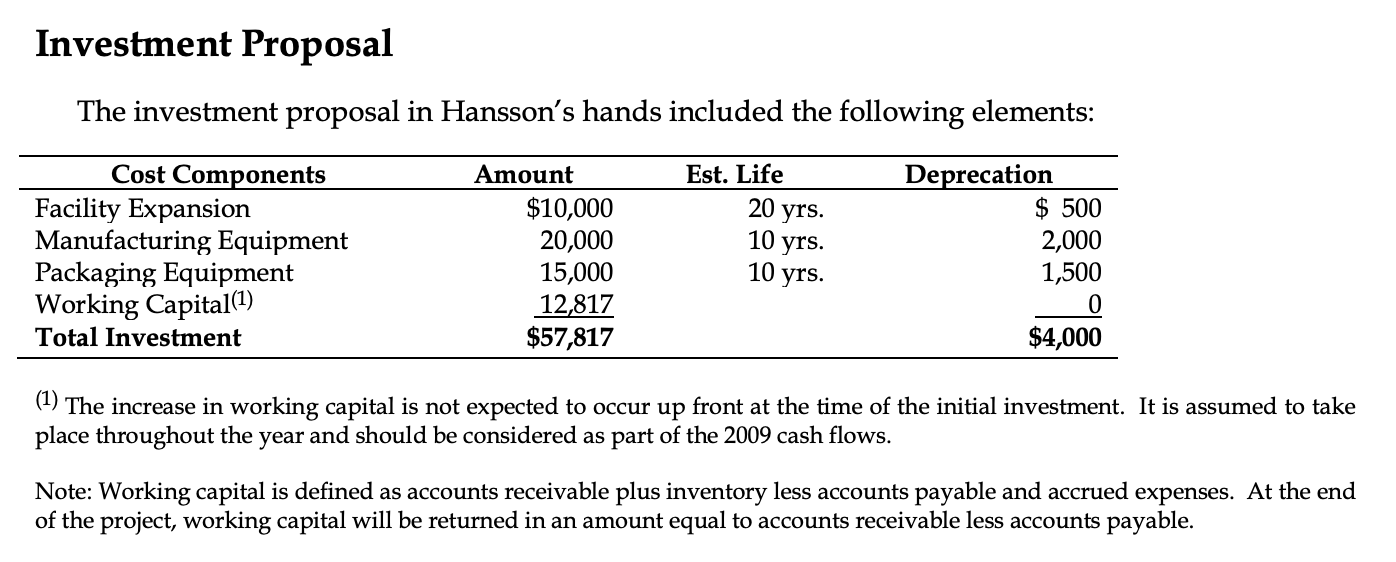
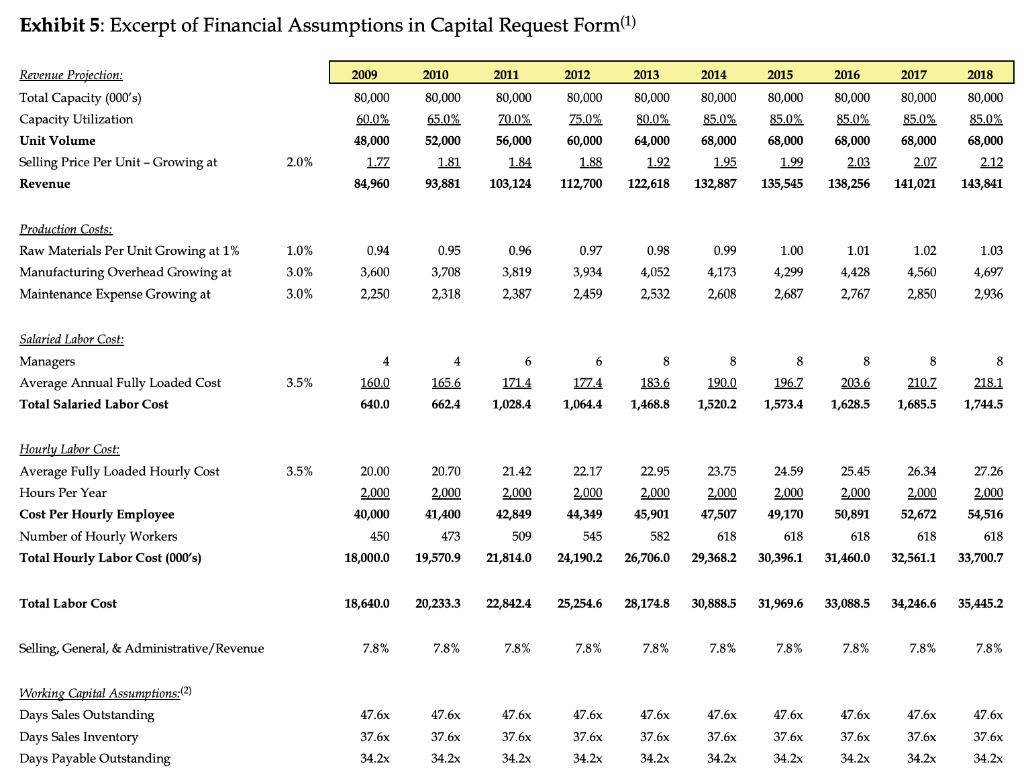
Investment Proposal The investment proposal in Hansson's hands included the following elements: Cost Components Facility Expansion Manufacturing Equipment Packaging Equipment Working Capital(1) Total Investment Amount $10,000 20,000 15,000 12,817 $57,817 Est. Life 20 yrs. 10 yrs. 10 yrs. Deprecation $ 500 2,000 1,500 $4,000 (1) The increase in working capital is not expected to occur up front at the time of the initial investment. It is assumed to take place throughout the year and should be considered as part of the 2009 cash flows. Note: Working capital is defined as accounts receivable plus inventory less accounts payable and accrued expenses. At the end of the project, working capital will be returned in an amount equal to accounts receivable less accounts payable. Exhibit 5: Excerpt of Financial Assumptions in Capital Request Form(1) Revenue Projection: Total Capacity (000's) Capacity Utilization Unit Volume Selling Price Per Unit - Growing at Revenue 2009 80,000 60.0% 48,000 1.77 84,960 2010 80,000 65.0% 52,000 1.81 93,881 2011 80,000 70.0% 56,000 1.84 103,124 2012 80,000 75.0% 60,000 1.88 112,700 2013 80,000 80.0% 64,000 1.92 122,618 2014 80,000 85.0% 68,000 1 .95 132,887 2015 80,000 85.0% 68,000 1.99 135,545 2016 80,000 85.0% 68,000 2.03 138,256 2017 80,000 85.0% 68,000 2 .07 141,021 2018 80,000 85.0% 68,000 2.12 143,841 2.0% 0.95 1 Production Costs: Raw Materials Per Unit Growing at 1% Manufacturing Overhead Growing at Maintenance Expense Growing at 1.0% 3.0% 3.0% 0.94 3,600 2,250 3,708 0.96 3,819 2,387 0.97 3,934 2,459 0.98 4,052 2,532 0.99 4,173 2,608 1.00 4,299 2,687 .01 4,428 2,767 1.02 4,560 2,850 1.03 4,697 2,936 2,318 Salaried Labor Cost: Managers Average Annual Fully Loaded Cost Total Salaried Labor Cost 3.5% 165,6 160.0 640.0 171.4 1,028.4 1774 1,064.4 183.6 1,468.8 190.0 1,520.2 196.7 1,573.4 203.6 1,628.5 8 210.7 1,685.5 8 218.1 1,744.5 662.4 3.5% Hourly Labor Cost: Average Fully Loaded Hourly Cost Hours Per Year Cost Per Hourly Employee Number of Hourly Workers Total Hourly Labor Cost (000's) 20.00 2,000 40,000 450 18,000.0 20.70 2,000 41,400 473 19,570. 9 21.42 2,000 42,849 509 21,814.0 22.17 2,000 44,349 545 24,190. 2 22.95 2,000 45,901 582 26,706. 0 23.75 2,000 47,507 618 29,368.2 24.59 2,000 49,170 618 30,396.1 25.45 2,000 50,891 618 31,460.0 26.34 2,000 52,672 618 32,561.1 27.26 2,000 54,516 618 33,700.7 Total Labor Cost 18,640.0 20,233.3 22,842. 4 2 5,254.6 28,174.8 30,888.5 31,969.6 33,088.5 34,246.6 35,445.2 Selling, General, & Administrative/Revenue 7.8% 7.8% 7.8% 7.8% 7.8% 7.8% 78% 7.8% 7.8% 7.8% 47.6x 47.6x 47.6% Working Capital Assumptions:(2) Days Sales Outstanding Days Sales Inventory Days Payable Outstanding 47.6x 37.6x 34.2x 47.6x 37.6x 47.6x 37.6x 34.2x 37.6x 47.6% 37.6% 34.2x 37.6x 34.2x 47.6% 37.6x 34.2x 47.6% 37.6x 34.2x 37.6% 47.6% 37.6x 34.2x 34.2x 34.2x 34.2x Investment Proposal The investment proposal in Hansson's hands included the following elements: Cost Components Facility Expansion Manufacturing Equipment Packaging Equipment Working Capital(1) Total Investment Amount $10,000 20,000 15,000 12,817 $57,817 Est. Life 20 yrs. 10 yrs. 10 yrs. Deprecation $ 500 2,000 1,500 $4,000 (1) The increase in working capital is not expected to occur up front at the time of the initial investment. It is assumed to take place throughout the year and should be considered as part of the 2009 cash flows. Note: Working capital is defined as accounts receivable plus inventory less accounts payable and accrued expenses. At the end of the project, working capital will be returned in an amount equal to accounts receivable less accounts payable. Exhibit 5: Excerpt of Financial Assumptions in Capital Request Form(1) Revenue Projection: Total Capacity (000's) Capacity Utilization Unit Volume Selling Price Per Unit - Growing at Revenue 2009 80,000 60.0% 48,000 1.77 84,960 2010 80,000 65.0% 52,000 1.81 93,881 2011 80,000 70.0% 56,000 1.84 103,124 2012 80,000 75.0% 60,000 1.88 112,700 2013 80,000 80.0% 64,000 1.92 122,618 2014 80,000 85.0% 68,000 1 .95 132,887 2015 80,000 85.0% 68,000 1.99 135,545 2016 80,000 85.0% 68,000 2.03 138,256 2017 80,000 85.0% 68,000 2 .07 141,021 2018 80,000 85.0% 68,000 2.12 143,841 2.0% 0.95 1 Production Costs: Raw Materials Per Unit Growing at 1% Manufacturing Overhead Growing at Maintenance Expense Growing at 1.0% 3.0% 3.0% 0.94 3,600 2,250 3,708 0.96 3,819 2,387 0.97 3,934 2,459 0.98 4,052 2,532 0.99 4,173 2,608 1.00 4,299 2,687 .01 4,428 2,767 1.02 4,560 2,850 1.03 4,697 2,936 2,318 Salaried Labor Cost: Managers Average Annual Fully Loaded Cost Total Salaried Labor Cost 3.5% 165,6 160.0 640.0 171.4 1,028.4 1774 1,064.4 183.6 1,468.8 190.0 1,520.2 196.7 1,573.4 203.6 1,628.5 8 210.7 1,685.5 8 218.1 1,744.5 662.4 3.5% Hourly Labor Cost: Average Fully Loaded Hourly Cost Hours Per Year Cost Per Hourly Employee Number of Hourly Workers Total Hourly Labor Cost (000's) 20.00 2,000 40,000 450 18,000.0 20.70 2,000 41,400 473 19,570. 9 21.42 2,000 42,849 509 21,814.0 22.17 2,000 44,349 545 24,190. 2 22.95 2,000 45,901 582 26,706. 0 23.75 2,000 47,507 618 29,368.2 24.59 2,000 49,170 618 30,396.1 25.45 2,000 50,891 618 31,460.0 26.34 2,000 52,672 618 32,561.1 27.26 2,000 54,516 618 33,700.7 Total Labor Cost 18,640.0 20,233.3 22,842. 4 2 5,254.6 28,174.8 30,888.5 31,969.6 33,088.5 34,246.6 35,445.2 Selling, General, & Administrative/Revenue 7.8% 7.8% 7.8% 7.8% 7.8% 7.8% 78% 7.8% 7.8% 7.8% 47.6x 47.6x 47.6% Working Capital Assumptions:(2) Days Sales Outstanding Days Sales Inventory Days Payable Outstanding 47.6x 37.6x 34.2x 47.6x 37.6x 47.6x 37.6x 34.2x 37.6x 47.6% 37.6% 34.2x 37.6x 34.2x 47.6% 37.6x 34.2x 47.6% 37.6x 34.2x 37.6% 47.6% 37.6x 34.2x 34.2x 34.2x 34.2x