Answered step by step
Verified Expert Solution
Question
1 Approved Answer
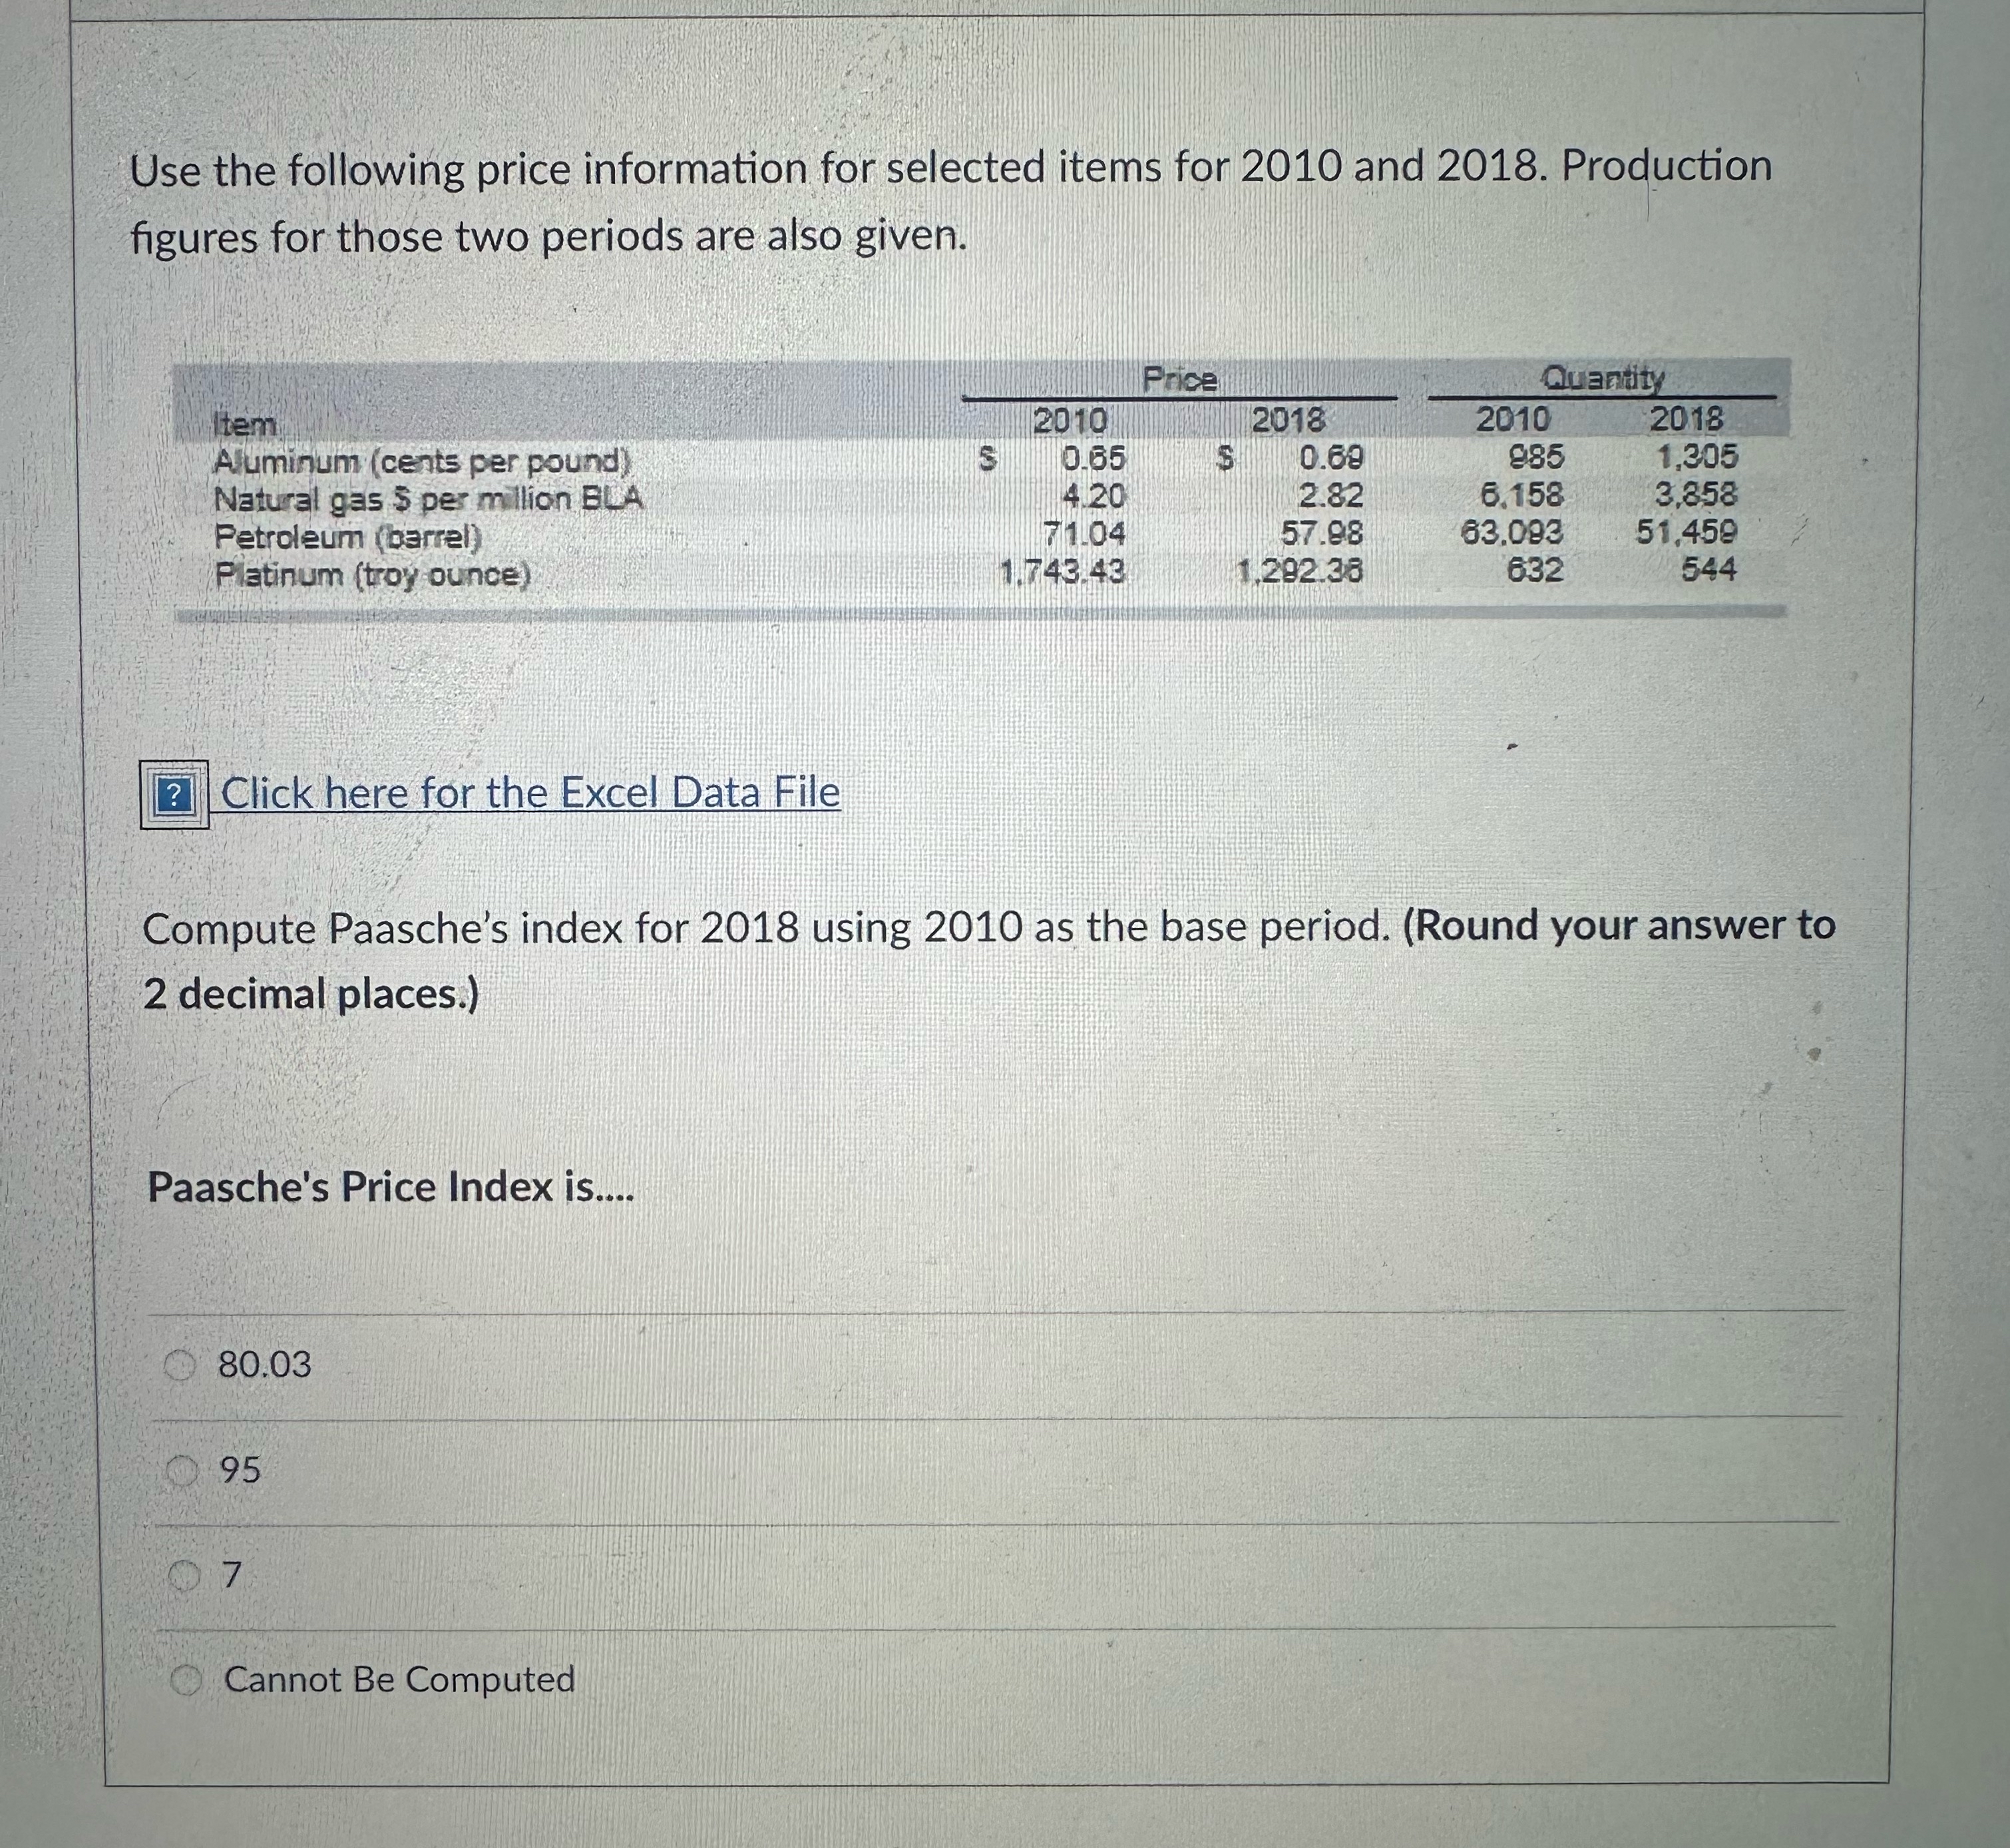
Use the following price information for selected items for 2 0 1 0 and 2 0 1 8 . Production figures for those two periods
Use the following price information for selected items for and Production figures for those two periods are also given.
tableItemPrice,QuantityAuminum cents per poundNatural gas per million BUA,Petroleum barrel

Step by Step Solution
There are 3 Steps involved in it
Step: 1

Get Instant Access to Expert-Tailored Solutions
See step-by-step solutions with expert insights and AI powered tools for academic success
Step: 2

Step: 3

Ace Your Homework with AI
Get the answers you need in no time with our AI-driven, step-by-step assistance
Get Started


