Answered step by step
Verified Expert Solution
Question
1 Approved Answer
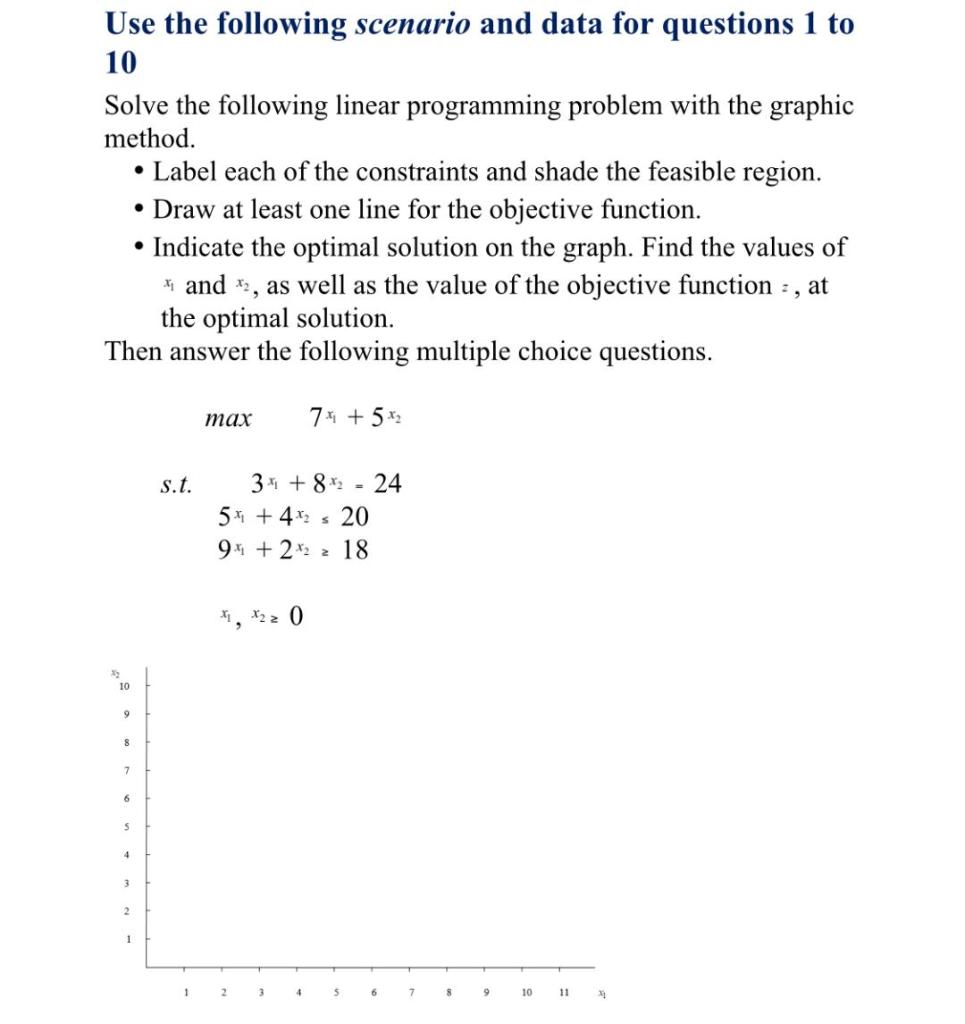
Use the following scenario and data for questions 1 to 10 Solve the following linear programming problem with the graphic method. Label each of


Use the following scenario and data for questions 1 to 10 Solve the following linear programming problem with the graphic method. Label each of the constraints and shade the feasible region. Draw at least one line for the objective function. Indicate the optimal solution on the graph. Find the values of * and *, as well as the value of the objective function =, at the optimal solution. Then answer the following multiple choice questions. * 10 9 8 7 6 S 4 3 2 s.t. max 7 +5 3824 5 +420 9 +218 1 2 3 4 5 6 7 8 9 10 11
Step by Step Solution
There are 3 Steps involved in it
Step: 1

Get Instant Access to Expert-Tailored Solutions
See step-by-step solutions with expert insights and AI powered tools for academic success
Step: 2

Step: 3

Ace Your Homework with AI
Get the answers you need in no time with our AI-driven, step-by-step assistance
Get Started


