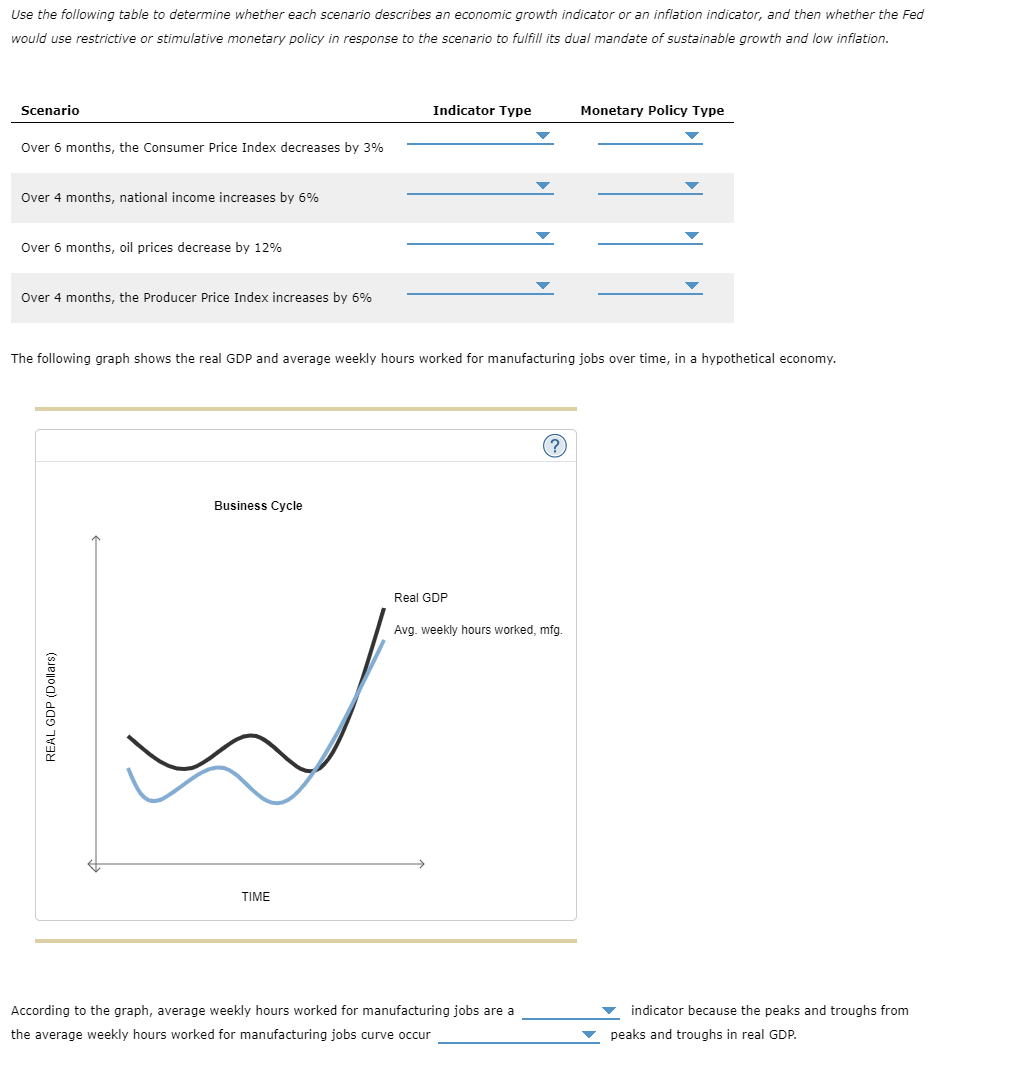
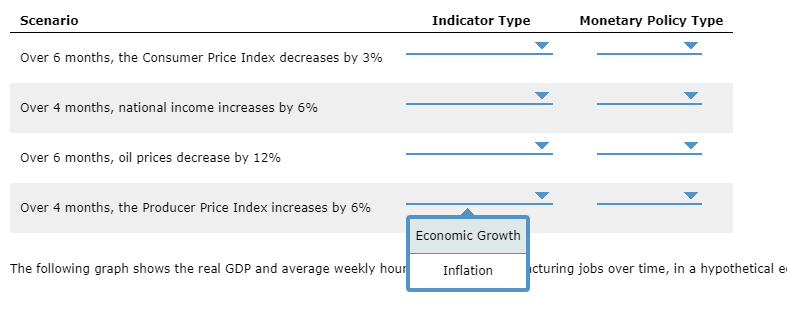
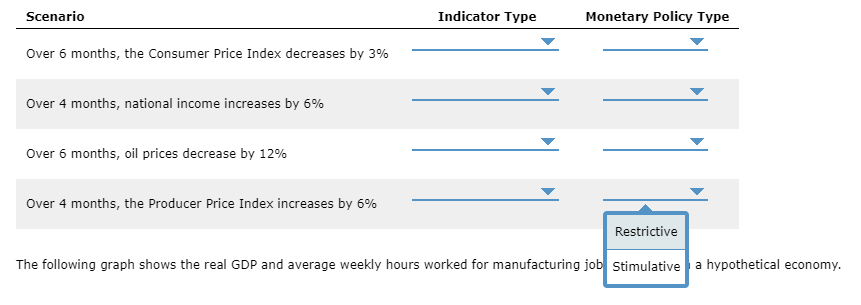
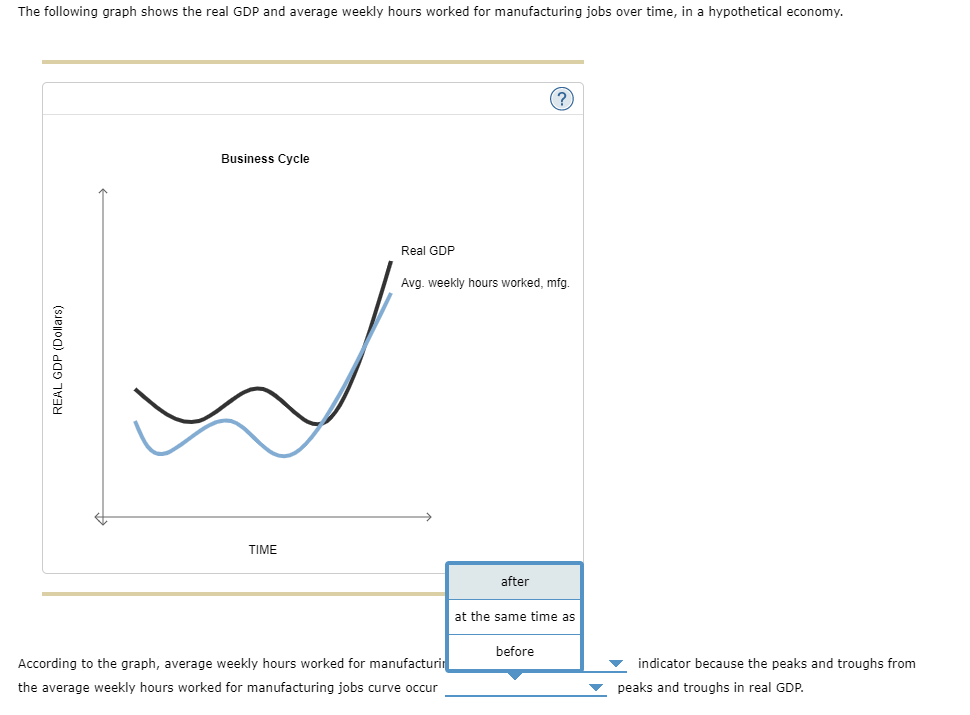
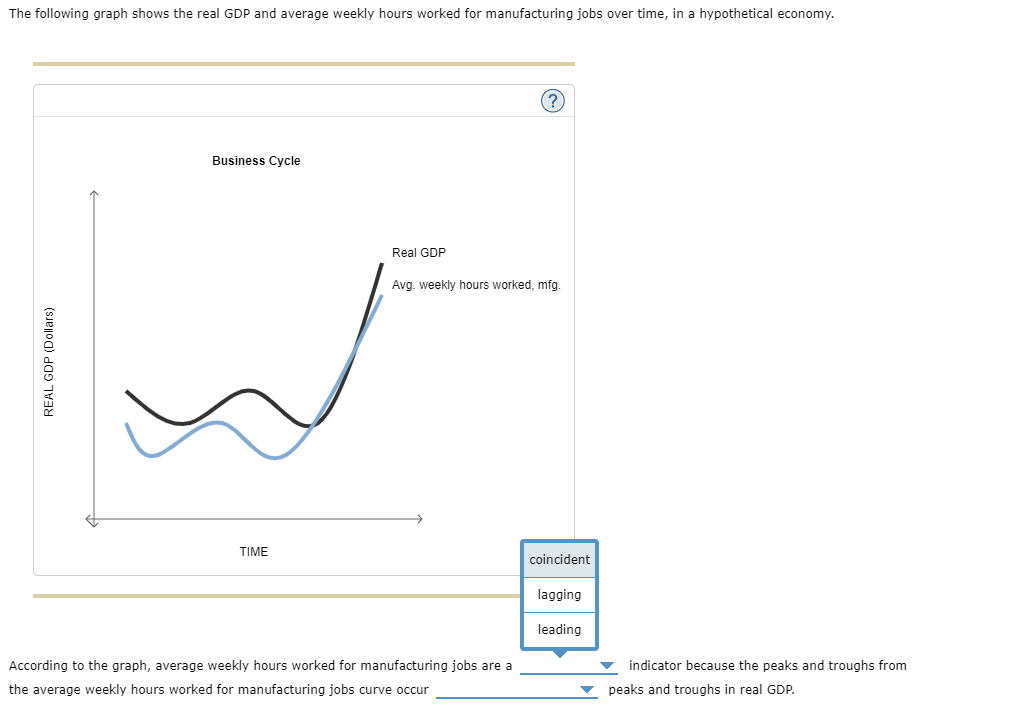
Use the following table to determine whether each scenario describes an economic growth indicator or an inflation indicator, and then whether the Fed would use restrictive or stimulative monetary policy in response to the scenario to fulfill its dual mandate of sustainable growth and low inflation. Scenario Indicator Type Monetary Policy Type Over 6 months, the Consumer Price Index decreases by 3% Over 4 months, national income increases by 6% Over 6 months, oil prices decrease by 12% Over 4 months, the Producer Price Index increases by 6% The following graph shows the real GDP and average weekly hours worked for manufacturing jobs over time, in a hypothetical economy. ? Business Cycle Real GDP Avg. weekly hours worked, mfg. REAL GDP (Dollars) w TIME According to the graph, average weekly hours worked for manufacturing jobs are a the average weekly hours worked for manufacturing jobs curve occur indicator because the peaks and troughs from peaks and troughs in real GDP. Scenario Indicator Type Monetary Policy Type Over 6 months, the Consumer Price Index decreases by 3% Over 4 months, national income increases by 6% Over 6 months, oil prices decrease by 12% Over 4 months, the Producer Price Index increases by 6% Economic Growth The following graph shows the real GDP and average weekly hour Inflation cturing jobs over time, in a hypothetical e Scenario Indicator Type Monetary Policy Type Over 6 months, the Consumer Price Index decreases by 3% Over 4 months, national income increases by 6% Over 6 months, oil prices decrease by 12% Over 4 months, the Producer Price Index increases by 6% Restrictive The following graph shows the real GDP and average weekly hours worked for manufacturing job Stimulative a hypothetical economy. The following graph shows the real GDP and average weekly hours worked for manufacturing jobs over time, in a hypothetical economy. ? Business Cycle Real GDP Avg. weekly hours worked, mfg. REAL GDP (Dollars) TIME after at the same time as before According to the graph, average weekly hours worked for manufacturin the average weekly hours worked for manufacturing jobs curve occur indicator because the peaks and troughs from peaks and troughs in real GDP. The following graph shows the real GDP and average weekly hours worked for manufacturing jobs over time, in a hypothetical economy. ? Business Cycle Real GDP Avg. weekly hours worked, mfg. REAL GDP (Dollars) TIME coincident lagging leading According to the graph, average weekly hours worked for manufacturing jobs are a the average weekly hours worked for manufacturing jobs curve occur indicator because the peaks and troughs from peaks and troughs in real GDP