

Answered step by step
Verified Expert Solution
Question
1 Approved Answer
Use the given data to do the following. ( a ) Find the regression equation for the data points. ( b ) Graph the regression
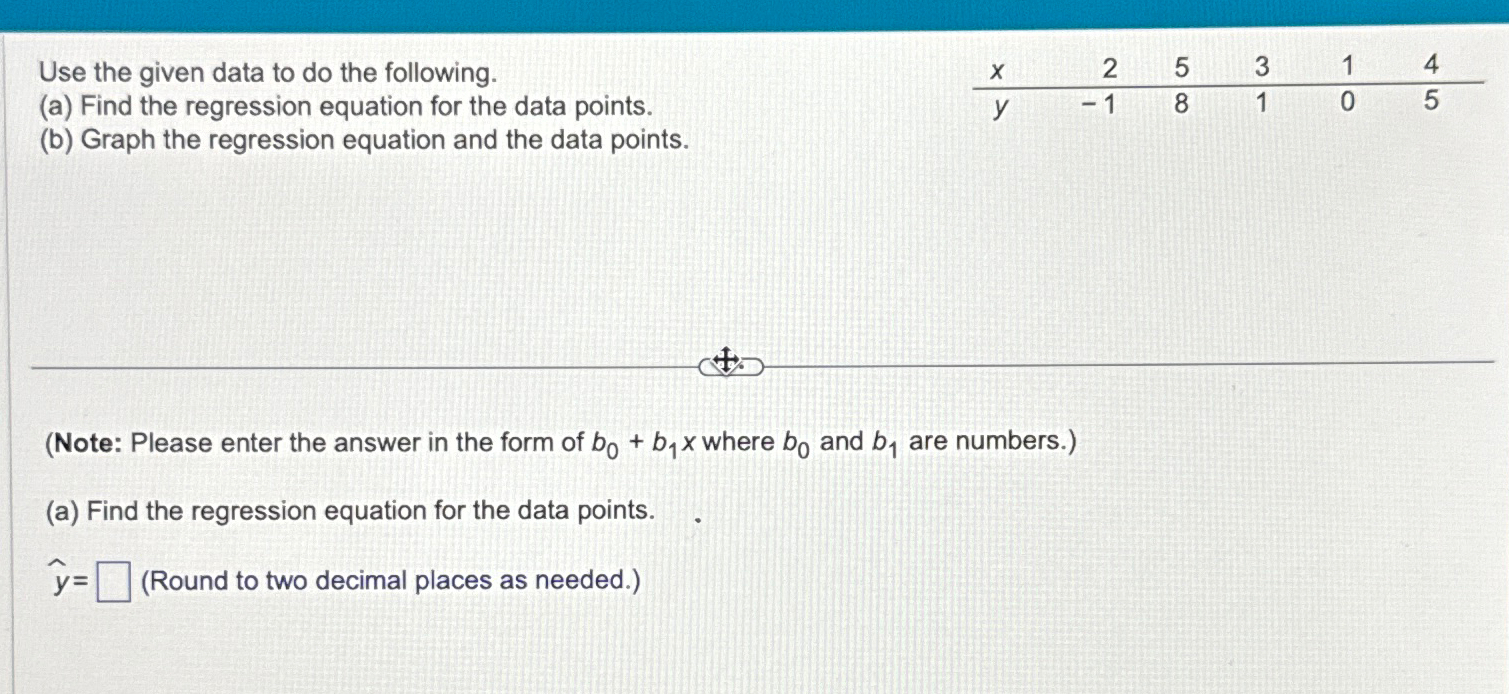
Use the given data to do the following.
a Find the regression equation for the data points.
b Graph the regression equation and the data points.
table
Note: Please enter the answer in the form of where and are numbers.
a Find the regression equation for the data points.
widehatRound to two decimal places as needed.
Step by Step Solution
There are 3 Steps involved in it
Step: 1

Get Instant Access to Expert-Tailored Solutions
See step-by-step solutions with expert insights and AI powered tools for academic success
Step: 2

Step: 3
Ace Your Homework with AI
Get the answers you need in no time with our AI-driven, step-by-step assistance
Get Started
Probability and Random Processes With Applications to Signal Processing and Communications
Authors: Scott Miller, Donald Childers
2nd edition
123869811, 978-0121726515, 121726517, 978-0130200716, 978-0123869814