

Answered step by step
Verified Expert Solution
Question
1 Approved Answer
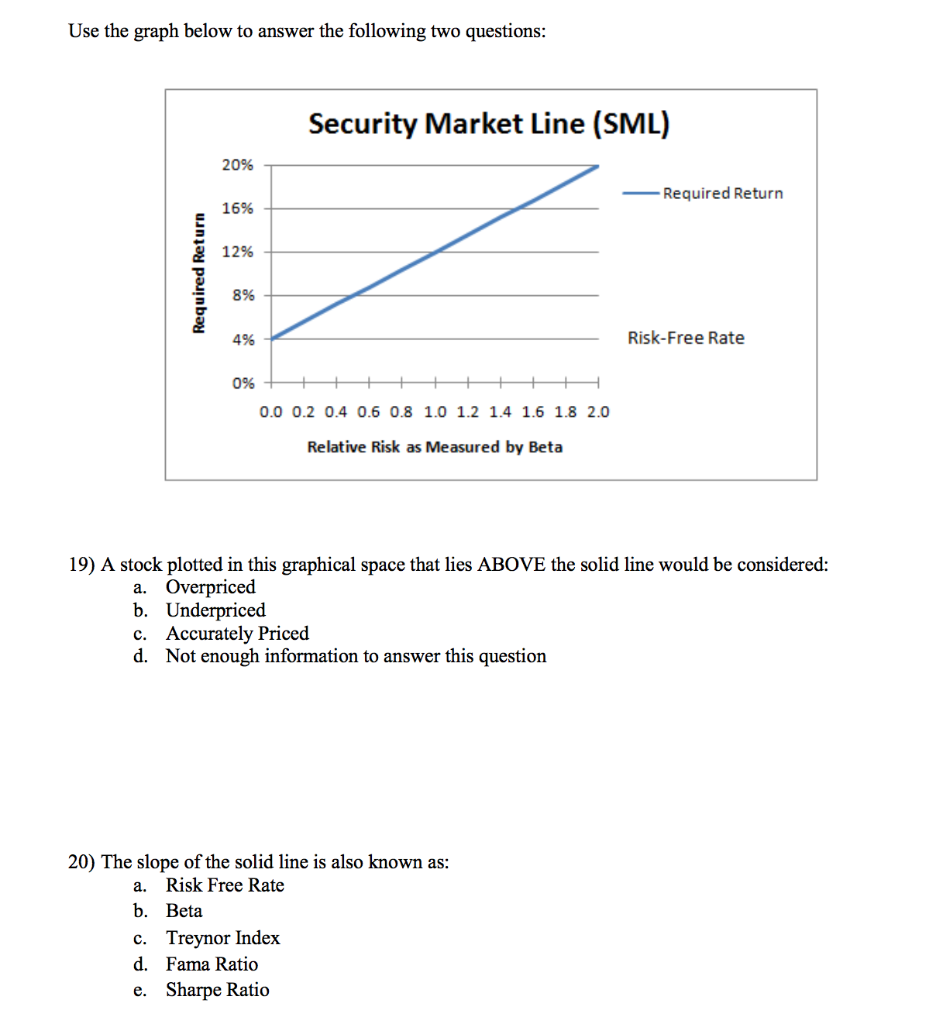
Use the graph below to answer the following two questions Security Market Line (SML) 20% 16% 12% 8% Required Return 4% Risk-Free Rate 096 0.0
Step by Step Solution
There are 3 Steps involved in it
Step: 1

Get Instant Access to Expert-Tailored Solutions
See step-by-step solutions with expert insights and AI powered tools for academic success
Step: 2

Step: 3
Ace Your Homework with AI
Get the answers you need in no time with our AI-driven, step-by-step assistance
Get Started
Too Much Is Not Enough Incentives In Executive Compensation
Authors: Robert W. Kolb
1st Edition
0199829586, 978-0199829583