Answered step by step
Verified Expert Solution
Link Copied!

Question

1 Approved Answer

Use the graph below to answer the questions that follow. 0 2 3 5 6 8 9 --2What is the maximum value of this function?
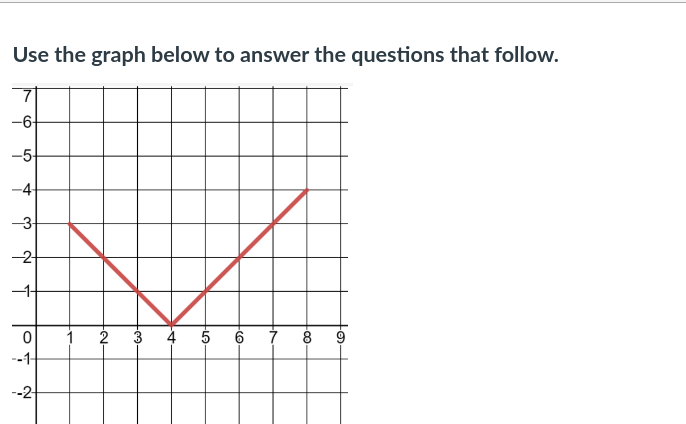
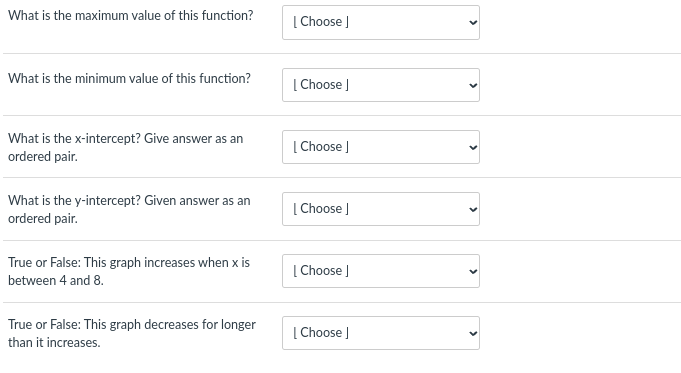
image text in transcribedimage text in transcribed
Use the graph below to answer the questions that follow. 0 2 3 5 6 8 9 --2What is the maximum value of this function? [ Choose ] What is the minimum value of this function? [ Choose ] What is the x-intercept? Give answer as an [ Choose ] ordered pair. What is the y-intercept? Given answer as an [ Choose ] ordered pair. True or False: This graph increases when x is [ Choose ] between 4 and 8. True or False: This graph decreases for longer [ Choose | than it increases

Step by Step Solution

There are 3 Steps involved in it

Step: 1

blur-text-image

Get Instant Access to Expert-Tailored Solutions

See step-by-step solutions with expert insights and AI powered tools for academic success

Step: 2

blur-text-image_2

Step: 3

blur-text-image_3

Ace Your Homework with AI

Get the answers you need in no time with our AI-driven, step-by-step assistance

Get Started

Recommended Textbook for

Quantitative Analysis For Management

Authors: Barry Render, Ralph M. Stair, Michael E. Hanna

11th Edition

9780132997621, 132149117, 132997622, 978-0132149112

Students also viewed these Mathematics questions