Question
Use the information contained in these financial statements and notes to complete this case. All answers should be for the most current year (September 24,
Use the information contained in these financial statements and notes to complete this case. All answers should be for the most current year (September 24, 2016) unless asked otherwise. Many companies show amounts in the thousands or millions please state amounts as shown on the financial statements. Do not add zeros. You do not need to include dollar signs.
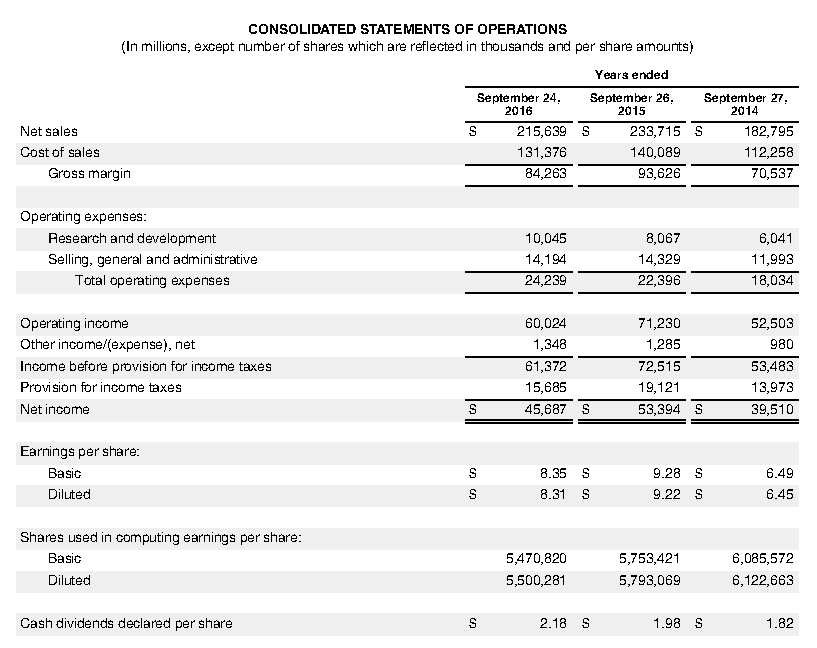
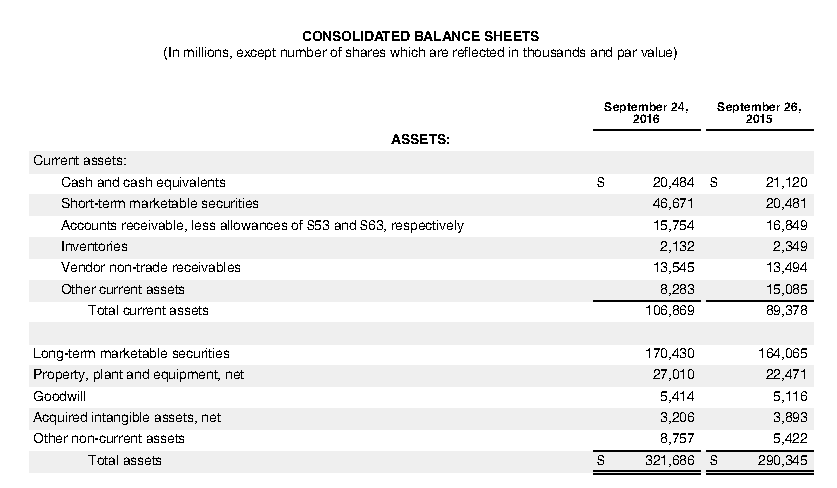
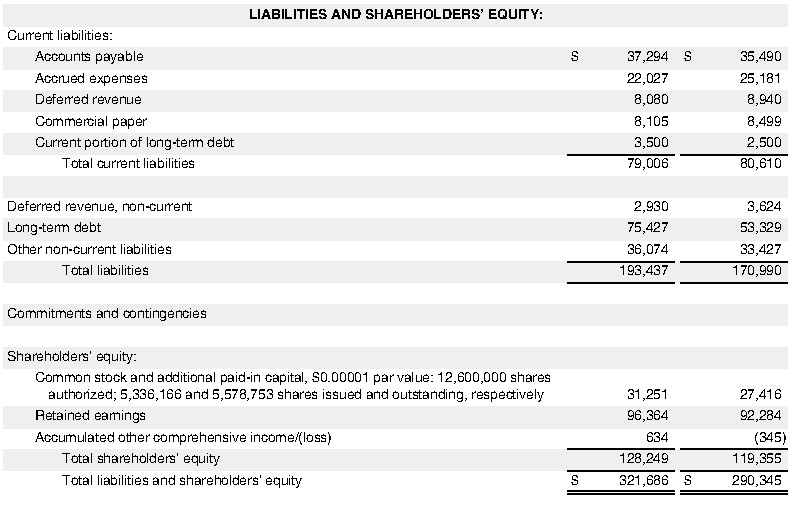
Selected financial statements of Apple, Inc. follow.


| 1. | Chapters 3 & 13 (pages 128, 127, 597) (24Points) | ||||||||||||
|
| Calculate the Current ratio. (4) Does this ratio appear favorable or unfavorable? (4) Why? (4)
Why? Current ratio shows the liquidity position of company. It shows the availability of short term assets of organisation to pay off its short term liabilities. the higher the ratio is better. Current ratio for year 2016 shows favourable liquidity position for the company. Increase in short term marketable securities is the main reason for increase in current ratio, which is favourable for the company.
| ||||||||||||
|
| b. Calculate the Profit Margin ratio. (4)Does this ratio appear favorable or unfavorable? (4) Why? (4) Profit Margin Ratio=( Net Income / Net Sales ) x100
Why? Profit margin ratio is a profitability ratio which shows the amount of net income for every dollar of sales made by the company during the year. Higher the ratio is always better, because it indicates that company is incurring very less expenses. In this case this ratio has decreased during the year very little, which is unfavourable for the company. decrease is very little so it is not the case of concern in this particular case.
| ||||||||||||
| 2. | Chapters 6, 7 & 13 (pages 327, 285, 597) (18 Points) | ||||||||||||
|
| a. Calculate the Accounts Receivable Turnover ratio. (8)
Accounts Receivable Turnover ratio- Accounts Receivable Turnover ratio- Net Credit Sales / Average Accounts Receivable Average Accounts Receivable = (Beginning Receivable + Ending Receivable)/2 Average Receivable = (15,754+16,849)/2 = 16,301.50 Accounts Receivable Turn over ratio= 215,639/16,301.50 = 13.23 times
It is an efficiency ratio which measures, how many times a business converts its receivable into cash during the period. In this case 13.23 times means company coverts its receivable into cash in 28 days (365 days/13.23 ). The figure is favourable for the company as company is collection money from its credit sales in 28 days which shows effective management of recovery of credit sales.
| ||||||||||||
|
| Calculate the Days Sales Uncollected ratio. (6) Does this ratio appear favorable or unfavorable? Why? (4) = ( Average Receivable/ Credit Sales ) x 365 Days = 27.59 ( say 28 Days)
Why? It indicates how many days a business takes to collect its credit sales. It is favourable for company because collection is made within 30 days of sales.
| ||||||||||||
| 3. | Chapters 8 & 13 (pages 367, 597) (6 Points) | ||||||||||||
|
| a. Calculate the Total Asset Turnover ratio. (6)
= ( Net Sales / Average Assets ) = (215,639 / 306,015.50) = 0.70 Times It is an efficiency ratio which shows companys ability to generate sales from its assets. As ratio is lower hence unfavourable for the company.
| ||||||||||||
|
|
| ||||||||||||
|
4. |
Chapters 2 & 13 (pages 77, 597) (8 Points) | ||||||||||||
|
| a. Calculate the Debt ratio. (4) What does this ratio tell you about Apples risk? (4) = Total Liabilities / Total Assets- = 193,437/321,686 =0.60 times
| ||||||||||||
| 5. | Chapters 10 & 13 (pages 451, 452, 593, 597) (8 Points) | ||||||||||||
|
| Calculate the Debt-to-Equity Ratio. (4)
What does this ratio tell you about Apples capital structure and risk? (4)
| ||||||||||||
| 6. | Chapters 11 & 13 (pages 501, 595, 596, 597) (20 Points) | ||||||||||||
|
|
| ||||||||||||
|
| What is the current market price of the stock? This is not in the financial statements provided. It is noted on Apples website or go to www.yahoofinance.com to get the quote. The ticker symbol for Apple is AAPL.
Price __________ (4)
Date found: ____________
| ||||||||||||
|
| Calculate the Dividend Yield. (4)
| ||||||||||||
|
| Calculate the Price-Earnings Ratio. (4)
What range do analyst give for a stock to be considered overpriced? (2)
What range do analyst give for a stock to be considered underpriced? (2)
What does this tell you about Apples stock price? Why? (4)
| ||||||||||||
| 7. | Chapters 5 & 13 (page 227, 597) (16 Points) | ||||||||||||
|
| Calculate the Inventory turnover ratio. (6)
| ||||||||||||
|
| Calculate the Days Sales in Inventory ratio. (6)
Is this favorable or unfavorable? Why? (4)
|
II. Summary (20 Points)
Your superior asks you to analyze this companys financial condition (liquidity, efficiency, solvency, profitability). Would you recommend it as a worthy investment (yes or no)? Support your opinion using answers from part I (#1-7) above. You must give at least five reasons to support your answer to receive full credit.
| 1. | Chapters 3 & 13 (pages 128, 127, 597) (24Points) | ||||||||||||
|
| Calculate the Current ratio. (4) Does this ratio appear favorable or unfavorable? (4) Why? (4)
Why? Current ratio shows the liquidity position of company. It shows the availability of short term assets of organisation to pay off its short term liabilities. the higher the ratio is better. Current ratio for year 2016 shows favourable liquidity position for the company. Increase in short term marketable securities is the main reason for increase in current ratio, which is favourable for the company.
| ||||||||||||
|
| b. Calculate the Profit Margin ratio. (4)Does this ratio appear favorable or unfavorable? (4) Why? (4) Profit Margin Ratio=( Net Income / Net Sales ) x100
Why? Profit margin ratio is a profitability ratio which shows the amount of net income for every dollar of sales made by the company during the year. Higher the ratio is always better, because it indicates that company is incurring very less expenses. In this case this ratio has decreased during the year very little, which is unfavourable for the company. decrease is very little so it is not the case of concern in this particular case.
| ||||||||||||
| 2. | Chapters 6, 7 & 13 (pages 327, 285, 597) (18 Points) | ||||||||||||
|
| a. Calculate the Accounts Receivable Turnover ratio. (8)
Accounts Receivable Turnover ratio- Accounts Receivable Turnover ratio- Net Credit Sales / Average Accounts Receivable Average Accounts Receivable = (Beginning Receivable + Ending Receivable)/2 Average Receivable = (15,754+16,849)/2 = 16,301.50 Accounts Receivable Turn over ratio= 215,639/16,301.50 = 13.23 times
It is an efficiency ratio which measures, how many times a business converts its receivable into cash during the period. In this case 13.23 times means company coverts its receivable into cash in 28 days (365 days/13.23 ). The figure is favourable for the company as company is collection money from its credit sales in 28 days which shows effective management of recovery of credit sales.
| ||||||||||||
|
| Calculate the Days Sales Uncollected ratio. (6) Does this ratio appear favorable or unfavorable? Why? (4) = ( Average Receivable/ Credit Sales ) x 365 Days = 27.59 ( say 28 Days)
Why? It indicates how many days a business takes to collect its credit sales. It is favourable for company because collection is made within 30 days of sales.
| ||||||||||||
| 3. | Chapters 8 & 13 (pages 367, 597) (6 Points) | ||||||||||||
|
| a. Calculate the Total Asset Turnover ratio. (6)
= ( Net Sales / Average Assets ) = (215,639 / 306,015.50) = 0.70 Times It is an efficiency ratio which shows companys ability to generate sales from its assets. As ratio is lower hence unfavourable for the company.
| ||||||||||||
|
|
| ||||||||||||
|
4. |
Chapters 2 & 13 (pages 77, 597) (8 Points) | ||||||||||||
|
| a. Calculate the Debt ratio. (4) What does this ratio tell you about Apples risk? (4) = Total Liabilities / Total Assets- = 193,437/321,686 =0.60 times
| ||||||||||||
| 5. | Chapters 10 & 13 (pages 451, 452, 593, 597) | ||||||||||||
|
| Calculate the Debt-to-Equity Ratio. (4)
What does this ratio tell you about Apples capital structure and risk? (4)
| ||||||||||||
| 6. | Chapters 11 & 13 (pages 501, 595, 596, 597) ( | ||||||||||||
|
|
| ||||||||||||
|
| What is the current market price of the stock? This is not in the financial statements provided. It is noted on Apples website or go to www.yahoofinance.com to get the quote. The ticker symbol for Apple is AAPL.
Price __________ (4)
Date found: ____________
| ||||||||||||
|
| Calculate the Dividend Yield. (4)
| ||||||||||||
|
| Calculate the Price-Earnings Ratio. (4)
What range do analyst give for a stock to be considered overpriced? (2)
What range do analyst give for a stock to be considered underpriced? (2)
What does this tell you about Apples stock price? Why? (4)
| ||||||||||||
| 7. | Chapters 5 & 13 (page 227, 597) | ||||||||||||
|
| Calculate the Inventory turnover ratio. (6)
| ||||||||||||
|
| Calculate the Days Sales in Inventory ratio. (6)
Is this favorable or unfavorable? Why? (4)
|
II. Summary
Your superior asks you to analyze this companys financial condition (liquidity, efficiency, solvency, profitability). Would you recommend it as a worthy investment (yes or no)? Support your opinion using answers from part I (#1-7) above. You must give at least five reasons to support your answer to receive full credit.


CONSOLIDATED STATEMENTS OF OPERATIONS (In millions, except number of shares which are reflected in thousands and per share amounts) Years ended September 24 September 26 September 27 2016 2015 2014 Net Sales 215,639 S 233,715 S 182,795 112,258 131,376 Cost of sales 140,089 93,626 70,537 Gross margin 84,263 Operating expenses: Research and development 10.045 8.067 6.041 11,993 Selling, general and administrative 14,194 14,329 Total operating expenses 24,239 22,396 18.034 71,230 60,024 Operating income 52,503 Other income/(expense), net 1,348 1,285 980 Income before provision for income taxes 72,515 53,483 61,372 13,973 Provision for income taxes 15685 19.121 Net income 45,687 S 53,394 S 39,510 Earnings per share: 9.28 S Basic 8.35 6.49 8.31 9.22 45 Diluted Shares used in computing earnings per share 5470,820 Basic 5,753,421 6,085,572 5,500,281 6,122,663 Diluted 5,793,069 Cash dividends declared per share 1.82
Step by Step Solution
There are 3 Steps involved in it
Step: 1

Get Instant Access to Expert-Tailored Solutions
See step-by-step solutions with expert insights and AI powered tools for academic success
Step: 2

Step: 3

Ace Your Homework with AI
Get the answers you need in no time with our AI-driven, step-by-step assistance
Get Started


