Use the information given in Problems 1.2 and 1.3 to update the Figure drawn in
Problem 1.1. Indicate the points of production and consumption for each nation with the
absence of trade and then with trade. Draw the trade triangles for the U.K and the U.S.
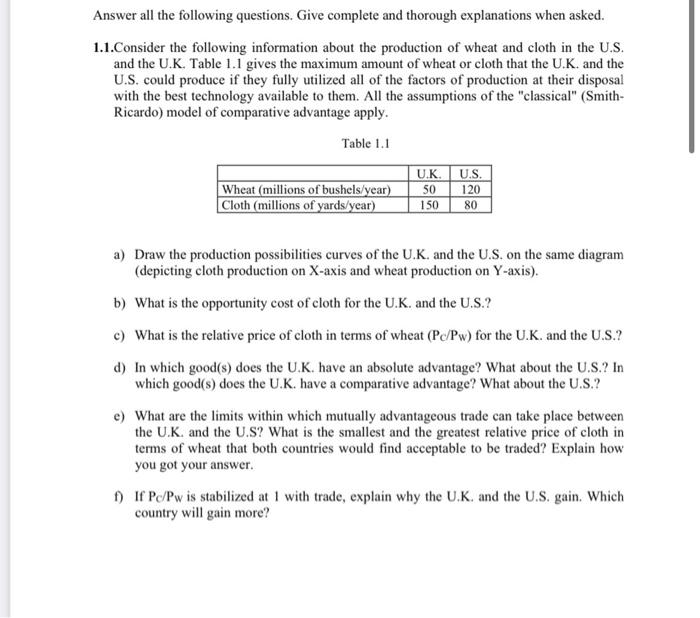
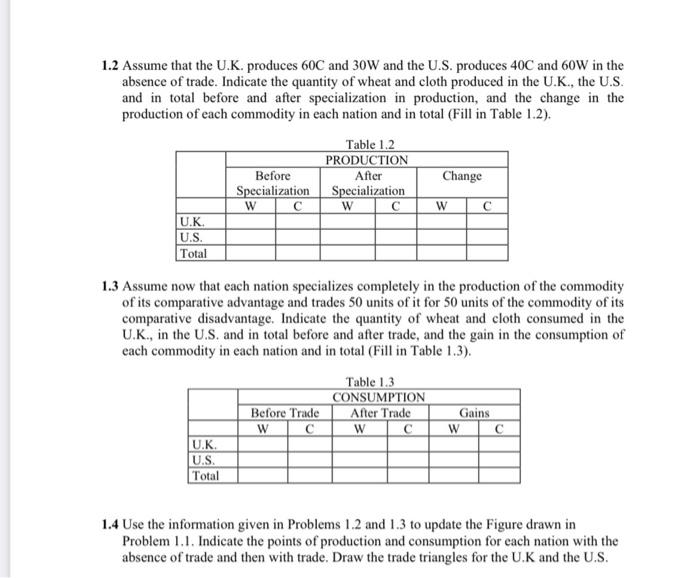
Answer all the following questions. Give complete and thorough explanations when asked. 1.1.Consider the following information about the production of wheat and cloth in the U.S. and the U.K. Table 1.1 gives the maximum amount of wheat or cloth that the U.K. and the U.S. could produce if they fully utilized all of the factors of production at their disposal with the best technology available to them. All the assumptions of the "classical" (Smith- Ricardo) model of comparative advantage apply. Table 1.1 U.K. U.S. 50 120 Wheat (millions of bushels/year) Cloth (millions of yards/year) 150 80 a) Draw the production possibilities curves of the U.K. and the U.S. on the same diagram (depicting cloth production on X-axis and wheat production on Y-axis). b) What is the opportunity cost of cloth for the U.K. and the U.S.? c) What is the relative price of cloth in terms of wheat (Pc/Pw) for the U.K. and the U.S.? d) In which good(s) does the U.K. have an absolute advantage? What about the U.S.? In which good(s) does the U.K. have a comparative advantage? What about the U.S.? e) What are the limits within which mutually advantageous trade can take place between the U.K. and the U.S? What is the smallest and the greatest relative price of cloth in terms of wheat that both countries would find acceptable to be traded? Explain how you got your answer. f) If Pc/Pw is stabilized at 1 with trade, explain why the U.K. and the U.S. gain. Which country will gain more? 1.2 Assume that the U.K. produces 60C and 30W and the U.S. produces 40C and 60W in the absence of trade. Indicate the quantity of wheat and cloth produced in the U.K., the U.S. and in total before and after specialization in production, and the change in the production of each commodity in each nation and in total (Fill in Table 1.2). Table 1.2 PRODUCTION After Change Before Specialization W C Specialization W C W C U.K. U.S. Total 1.3 Assume now that each nation specializes completely in the production of the commodity of its comparative advantage and trades 50 units of it for 50 units of the commodity of its comparative disadvantage. Indicate the quantity of wheat and cloth consumed in the U.K., in the U.S. and in total before and after trade, and the gain in the consumption of each commodity in each nation and in total (Fill in Table 1.3). Table 1.3 CONSUMPTION After Trade Before Trade Gains W W C W U.K. U.S. Total 1.4 Use the information given in Problems 1.2 and 1.3 to update the Figure drawn in Problem 1.1. Indicate the points of production and consumption for each nation with the absence of trade and then with trade. Draw the trade triangles for the U.K and the U.S. Answer all the following questions. Give complete and thorough explanations when asked. 1.1.Consider the following information about the production of wheat and cloth in the U.S. and the U.K. Table 1.1 gives the maximum amount of wheat or cloth that the U.K. and the U.S. could produce if they fully utilized all of the factors of production at their disposal with the best technology available to them. All the assumptions of the "classical" (Smith- Ricardo) model of comparative advantage apply. Table 1.1 U.K. U.S. 50 120 Wheat (millions of bushels/year) Cloth (millions of yards/year) 150 80 a) Draw the production possibilities curves of the U.K. and the U.S. on the same diagram (depicting cloth production on X-axis and wheat production on Y-axis). b) What is the opportunity cost of cloth for the U.K. and the U.S.? c) What is the relative price of cloth in terms of wheat (Pc/Pw) for the U.K. and the U.S.? d) In which good(s) does the U.K. have an absolute advantage? What about the U.S.? In which good(s) does the U.K. have a comparative advantage? What about the U.S.? e) What are the limits within which mutually advantageous trade can take place between the U.K. and the U.S? What is the smallest and the greatest relative price of cloth in terms of wheat that both countries would find acceptable to be traded? Explain how you got your answer. f) If Pc/Pw is stabilized at 1 with trade, explain why the U.K. and the U.S. gain. Which country will gain more? 1.2 Assume that the U.K. produces 60C and 30W and the U.S. produces 40C and 60W in the absence of trade. Indicate the quantity of wheat and cloth produced in the U.K., the U.S. and in total before and after specialization in production, and the change in the production of each commodity in each nation and in total (Fill in Table 1.2). Table 1.2 PRODUCTION After Change Before Specialization W C Specialization W C W C U.K. U.S. Total 1.3 Assume now that each nation specializes completely in the production of the commodity of its comparative advantage and trades 50 units of it for 50 units of the commodity of its comparative disadvantage. Indicate the quantity of wheat and cloth consumed in the U.K., in the U.S. and in total before and after trade, and the gain in the consumption of each commodity in each nation and in total (Fill in Table 1.3). Table 1.3 CONSUMPTION After Trade Before Trade Gains W W C W U.K. U.S. Total 1.4 Use the information given in Problems 1.2 and 1.3 to update the Figure drawn in Problem 1.1. Indicate the points of production and consumption for each nation with the absence of trade and then with trade. Draw the trade triangles for the U.K and the U.S