

Question
Use the information in the image Product Buy Data for Graphs and provide visual representations of the data. Create graphs. Graph and explain the results
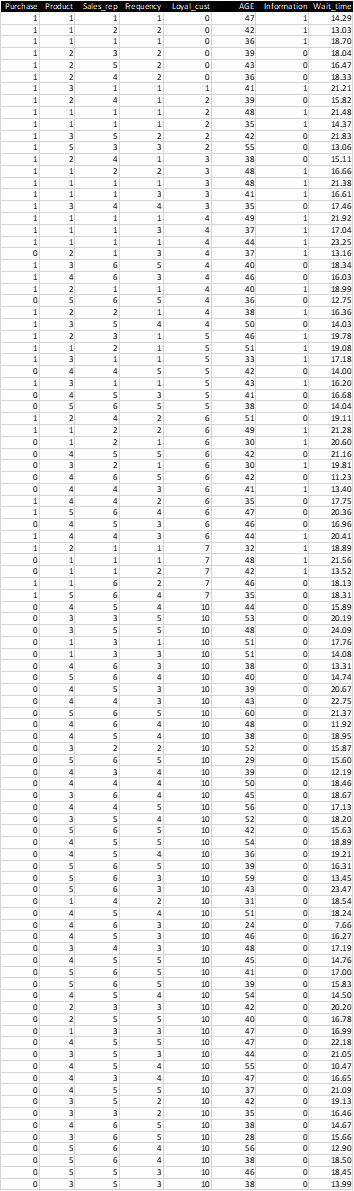
Use the information in the image "Product Buy Data for Graphs" and provide visual representations of the data. Create graphs. Graph and explain the results for each of the following visual representations of the data: ? Create a pie chart to showcase purchases ? Create a bar chart to showcase product ? Create a bar chart to showcase sales representatives ? Create a scatterplot to showcase loyalty ? Create a line chart to showcase wait time (in minutes) VARIABLE CODING (Data file: Product Buy Data for Graphs.xls) Purchase 0 No Buy 1 Buy Product 1 Not Happy 2 Somewhat Happy 3 Happy 4 Very Happy 5 Extremely Happy Sales Representation 1 Very Unfavorable 7 Very Favorable Frequency of Visits 1 Never 2 Rarely 3 Occasionally 4 Often 5 Very Often Loyal Customer 0 Strongly Disagree 10 Strongly Agree Main Source of Information 0 Social Media 1 TV Wait Time (Minutes)
Image of "Product Buy Data for Graphs":
Step by Step Solution
There are 3 Steps involved in it
Step: 1

Get Instant Access to Expert-Tailored Solutions
See step-by-step solutions with expert insights and AI powered tools for academic success
Step: 2

Step: 3
Ace Your Homework with AI
Get the answers you need in no time with our AI-driven, step-by-step assistance
Get Started
Mathematical Analysis For Quantitative Finance
Authors: Daniele Ritelli, Giulia Spaletta
1st Edition
1351245104, 9781351245104