

Question
Use the information provided to create a trend analysis and answer the following for the trend analysis: 1.What are the total revenue, total costs of
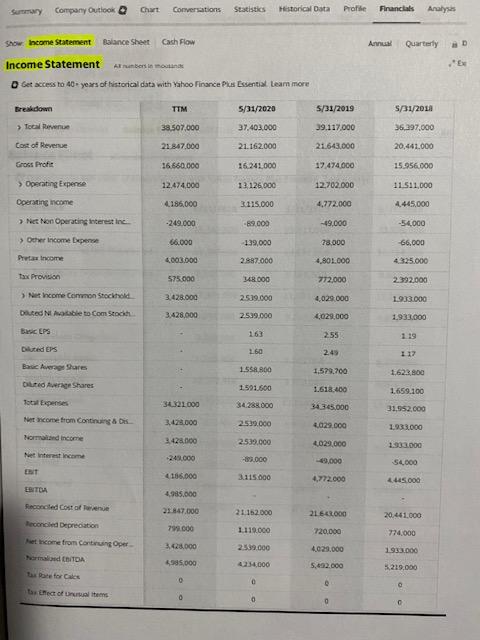
Use the information provided to create a trend analysis and answer the following for the trend analysis:
1.What are the total revenue, total costs of revenue, and net income for each year?
2.How have these numbers changed over the three years and what could be some reasons why these numbers have changed the way they have?
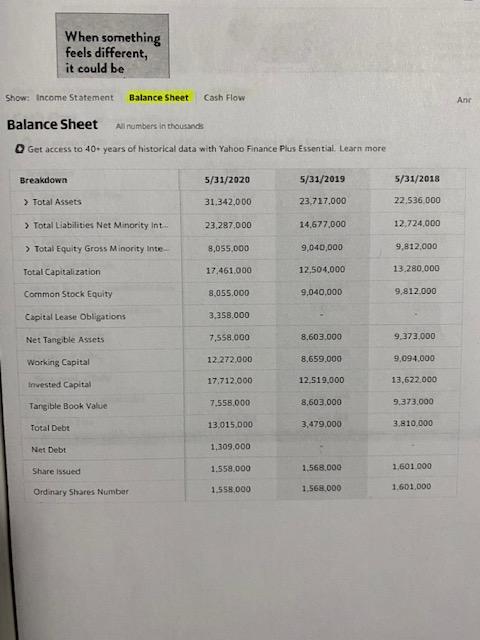
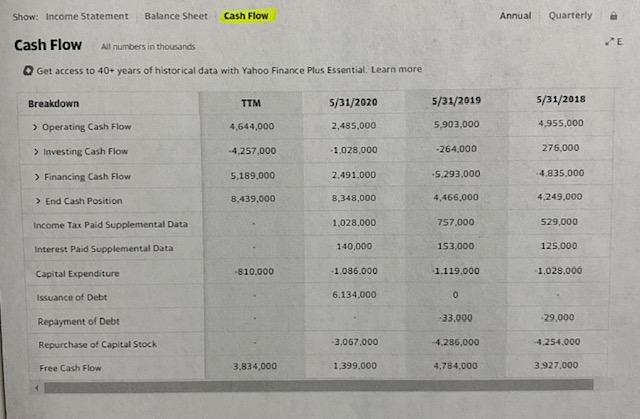
3.Pick at least one appropriate ratio or financial analysis listed in addition to what is provided and calculate that and explain it.
Pick ONE:
Beta
Current ratio
Quick Ratio
Profit Margin
EBIT Return on Assets
Return on Equity
Debt-equity ratio.
Company Outlook Chart Conversations Statistics Sury Historical Data Prati Financials Analys Show Income Statement Balance Sheet Cash Flow Anna Quarterly D Income Statement Arbeiten EX Set access to 40 years of historical data with Yahoo Finance Plus Essential team more Breakdown TTM 5/31/2020 5/31/2019 S/31/2011 > Tocal Revenue 38.507.000 37.403.000 39.117.000 36.297.000 Cost of Revenue 21.847.000 21.162.000 21.643.000 20,441.000 Gross Profit 16.550.000 16.241.000 17.474.000 15.956.000 > Operating Expense 12.474.000 13.126.000 12.702.000 11.511.000 Operating income 4185.000 34115.000 4.772.000 4.445.000 Nes Non Operating interest in -249.000 - 89.000 -49.000 -54.000 > Other Income Expense 66.000 139,000 78.000 66,000 Pretax income 4003.000 2887.000 4.801.000 4325.000 Tax Provision 575.000 148.000 772,000 2.392.000 > Net Income Common Stockhold 3.428.000 2.539.000 4,029.000 1.933.000 Duted Nobeto Com Soch 3.428,000 2.539.000 46029,000 1933.000 BEPS 255 119 Diluted EPS 260 245 117 Baschera Sures 1.558,800 1.529.700 Duted ArgeShares 1591,600 1.618.400 1.659.100 34321.000 34288.000 34 365.000 31.552.000 Netcome from Continuing & Dis 3.478.000 2539.000 4029.000 1.933.000 Normand income 2.428.000 259.000 4029.000 1.933.000 Net interest income -245.000 -8.000 -9.000 $4,000 4165.000 3.115.000 4,772.000 4445.000 ESITOA 4.985.000 Reconciled cost of een 21847.000 21.152.000 21642.000 20.441.000 799.000 1119.000 720.000 774.000 Reconciled Depreciation et come from Corting Oper her CBITDA 3.628.000 2539.000 4029.000 1933.000 495,000 234.000 5.492.000 5219.000 tore for Cales to the others 0 0 0 When something feels different, it could be Show: Income Statement Balance Sheet Cash Flow And Balance Sheet All numbers in thousands Get access to 40-years of historical data with Yahoo Finance Plus Essential Learn more Breakdown 5/31/2020 5/31/2019 5/31/2018 > Total Assets 31.342.000 23.717.000 22.536.000 > Total Liabilities Net Minority int... 23.287,000 14,677,000 12,724.000 > Total Equity Gross Minority Inte- 8,055,000 9,040,000 9,812,000 17.461.000 Total Capitalization 12,504.000 13.280.000 Common Stock Equity 8.055.000 9,040,000 9.812.000 Capital Lease Obligations 3,358.000 7.558,000 8.603.000 Net Tangible Assets 9,373.000 12.272.000 Working Capital 8,659.000 9,094.000 17.712.000 12,519.000 13,622.000 Invested Capital 7,558.000 8,603,000 9.373.000 Tangible Book Value 13.015.000 3.479,000 3.810.000 Total Debt Net Debt 1,309,000 1.558,000 1,568,000 Share issued 1.601.000 1.558.000 Ordinary Shares Number 1.568.000 1.601,000 Show: Income Statement Balance Sheet Cash Flow Annual Quarterly Cash Flow All numbers in thousands WE Get access to 40+ years of historical data with Yahoo Finance Plus Essential. Learn more Breakdown TTM 5/31/2020 5/31/2019 5/31/2018 4,644,000 > Operating Cash Flow 2,485.000 5.903.000 4,955,000 -4.257.000 > Investing Cash Flow -1,028,000 -264,000 276,000 5.189.000 > Financing Cash Flow 2.491.000 4.835.000 -5.293.000 8,439,000 > End Cash Position 8,348,000 4,466.000 4.249.000 Income Tax Paid Supplemental Data 1,028,000 757.000 529,000 Interest Paid Supplemental Data 140,000 153,000 125.000 Capital Expenditure -810.000 1.086.000 1.119.000 1.028.000 Issuance of Debt 6.134.000 0 33.000 29.000 Repayment of Debt Repurchase of Capital Stock 3,067.000 4.286,000 4.254.000 Free Cash Flow 3.834.000 1,399.000 4.784.000 3.927.000Step by Step Solution
There are 3 Steps involved in it
Step: 1

Get Instant Access to Expert-Tailored Solutions
See step-by-step solutions with expert insights and AI powered tools for academic success
Step: 2

Step: 3
Ace Your Homework with AI
Get the answers you need in no time with our AI-driven, step-by-step assistance
Get Started
Eco Management The Elmwood Guide To Ecological Auditing And Sustainable Business
Authors: Ernest Callenbach, Fritjof Capra, Lenore Goldman, Rudiger Lutz
1st Edition
1881052273, 978-1881052272