Question
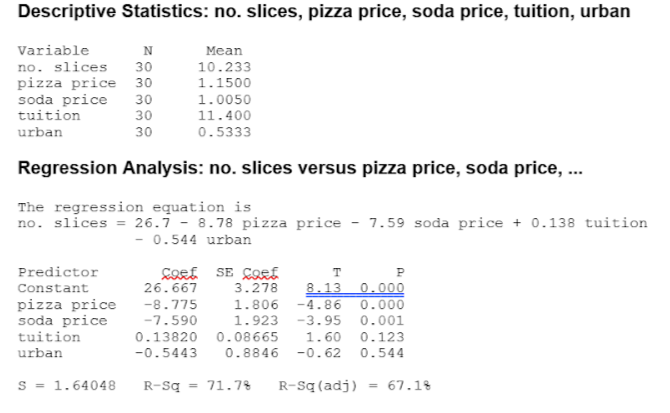
Use the information to answer the following questions A). Use the regression output and descriptive statistics to calculate the following elasticities: PED = What does

Use the information to answer the following questions
A). Use the regression output and descriptive statistics to calculate the following elasticities:
PED =
What does this elasticity tell you about consumer demand for a universitys pizza?
How could a universitys food services manager use this information to improve the performance associated with pizza sales?
CED =
What does this elasticity tell you about consumer demand for a universitys pizza?
How could a universitys food services manager use this information to improve the performance associated with pizza sales?
The food services manager suspects that students who attend universities with higher tuition are less price sensitive. To answer these questions we need to do more regression analysis in the PC lab (on Minitab).
To determine if higher income students, or those students who attend universities with higher tuition, are less price sensitive, we need to estimate a regression with the interaction of pizza price and tuition (by multiplying price and tuition in the Calculate tab). Do this calculation and then add the multiplicative term to the regression (keep all of the other independent variables, just add the interactive term). Use the output from that regression to answer the questions for #2 below.
A). Does the partial derivative with respect to price (from the new regression) support the managers view that student at higher-tuition universities are less price sensitive? (also take into consideration the t-statistic for the interaction term in determining how much confidence you have in reaching this conclusion)
B) How could the manager use this information (if she is working at a high-tuition university)?
For practice lets see if there is a maximum or minimum demand for pizza with respect to tuition. To do this you will need to calculate tuition-squared in Mintab. Once you have done this, add the new tuition-squared to the list of independent variables in the original regression (pizza price, soda price, tuition, and urban). Be sure and take the interaction variable between price and tuition out of the list of independent variables.
Do your regression results indicate a maximum or minimum?
What is the level of income that minimizes pizza demand?
Based on the t-statistics for the tuition variables from original regression of pizza and from this new regression with tuition and tuition-squared, which estimate do you think is more accurate (with respect to the effect of tuition)?
Descriptive Statistics: no. slices, pizza price, soda price, tuition, urban Regression Analysis: no. slices versus pizza price, soda price, ... The regression equation is no.slices=26.78.78pizzaprice7.59sodaprice+0.138tuition0.544urban
Step by Step Solution
There are 3 Steps involved in it
Step: 1

Get Instant Access to Expert-Tailored Solutions
See step-by-step solutions with expert insights and AI powered tools for academic success
Step: 2

Step: 3

Ace Your Homework with AI
Get the answers you need in no time with our AI-driven, step-by-step assistance
Get Started


