Answered step by step
Verified Expert Solution
Question
1 Approved Answer
Use the information to complete the following (showing full working): a The per-share valuation estimate range for Coca-Colas common stock at 31 January 2012 on


Use the information to complete the following (showing full working):
a The per-share valuation estimate range for Coca-Colas common stock at 31 January 2012 on the DCF basis
b. The per-share valuation estimate range for Coca Cola's common stock at 31 January 2012 on the Residual Income basis.
c. The key assumptions made during the valuation exercise and your justification for using them.
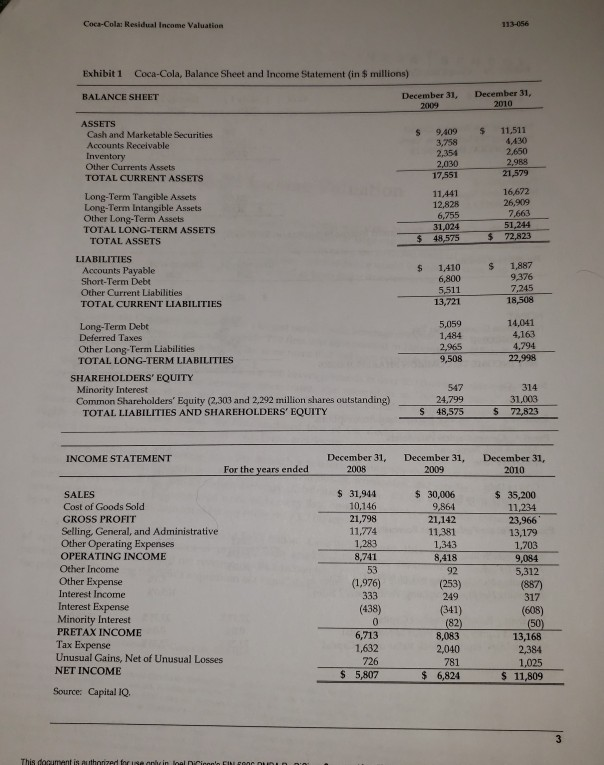
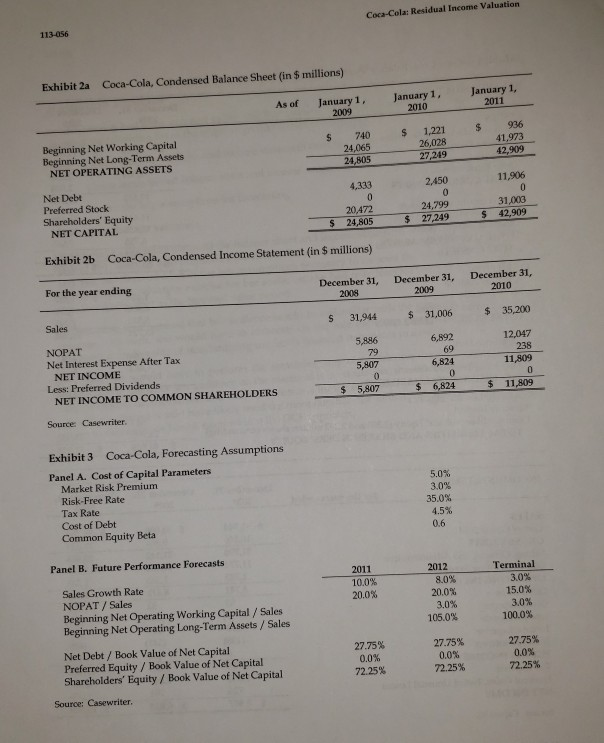
Coca-Cola Residual Income Valuation 113-056 Exhibit 1 Coca-Cola, Balance Sheet and Income Statement in $ millions) BALANCE SHEET December 31, 2009 December 31, 2010 $ $ 11.511 ASSETS Cash and Marketable Securities Accounts Receivable Inventory Other Currents Assets TOTAL CURRENT ASSETS 9.409 3,758 2,354 2,030 17,551 2,650 2,988 21,579 Long-Term Tangible Assets Long-Term Intangible Assets Other Long-Term Assets TOTAL LONG-TERM ASSETS TOTAL ASSETS 11.441 12,828 6,755 31,024 48,575 16,672 26,909 7,663 51,244 $ 72,823 $ $ $ LIABILITIES Accounts Payable Short-Term Debt Other Current Liabilities TOTAL CURRENT LIABILITIES 1.410 6,800 5,511 13,721 1,887 9,376 7.245 18,508 5,059 1,484 2,965 14,041 4,163 4.794 22,998 9,508 Long-Term Debt Deferred Taxes Other Long-Term Liabilities TOTAL LONG-TERM LIABILITIES SHAREHOLDERS' EQUITY Minority Interest Common Shareholders' Equity (2,303 and 2,292 million shares outstanding) TOTAL LIABILITIES AND SHAREHOLDERS' EQUITY 547 24,799 S48,575 314 31,003 $ 72,823 INCOME STATEMENT December 31, 2008 December 31, 2009 December 31, 2010 For the years ended SALES Cost of Goods Sold GROSS PROFIT Selling, General, and Administrative Other Operating Expenses OPERATING INCOME Other Income Other Expense Interest Income Interest Expense Minority Interest PRETAX INCOME Tax Expense Unusual Gains, Net of Unusual Losses NET INCOME $ 31,944 10,146 21,798 11,774 1,283 8,741 53 (1.976) 333 (438) 0 6,713 1,632 726 $ 5,807 $ 30,006 9,864 21,142 11,381 1,343 8,418 92 (253) 249 (341) (82) 8,083 2,040 781 $ 6,824 $ 35,200 11,234 23,966 13,179 1,703 9,084 5,312 (887) 317 (608) (50) 13,168 2,384 1,025 $ 11,809 Source: Capital IQ 3 This document is authorized for innhein CINC nin na Coca-Cola: Residual Income Valuation 113-056 Exhibit 2a Coca-Cola, Condensed Balance Sheet (in $ millions) January 1, 2011 As of January 1, 2009 January 1, 2010 $ $ $ 740 24,065 24,805 1,221 26,028 27,249 936 41,973 42.909 Beginning Net Working Capital Beginning Net Long-Term Assets NET OPERATING ASSETS Net Debt Preferred Stock Shareholders' Equity NET CAPITAL 4,333 0 20,472 $ 24,805 2,450 0 24,799 $ 27,249 11,906 0 31,003 $ 42,909 Exhibit 2b Coca-Cola, Condensed Income Statement (in $ millions) December 31, 2008 December 31, 2009 December 31, 2010 For the year ending $ 31.944 $ 31,006 $ 35,200 Sales NOPAT Net Interest Expense After Tax NET INCOME Less: Preferred Dividends NET INCOME TO COMMON SHAREHOLDERS 5,886 79 5,807 0 $ 5,807 6,892 69 6,824 0 6,824 12,047 238 11,809 0 11,809 $ $ Source: Casewriter Exhibit 3 Coca-Cola, Forecasting Assumptions Panel A. Cost of Capital Parameters Market Risk Premium Risk-Free Rate Tax Rate Cost of Debt Common Equity Beta 5.0% 3.0% 35.0% 4.5% 0.6 Panel B. Future Performance Forecasts 2011 10.0% 20.0% 2012 8.0% 20.0% 3.0% 105.0% Terminal 3.0% 15.0% 3.0% 100.0% Sales Growth Rate NOPAT/ Sales Beginning Net Operating Working Capital / Sales Beginning Net Operating Long-Term Assets / Sales Net Debt / Book Value of Net Capital Preferred Equity / Book Value of Net Capital Shareholders' Equity / Book Value of Net Capital Source: Casewriter 27.75% 0.0% 72.25% 27.75% 0.0% 72.25% 27.75% 0.0% 72.25% Coca-Cola Residual Income Valuation 113-056 Exhibit 1 Coca-Cola, Balance Sheet and Income Statement in $ millions) BALANCE SHEET December 31, 2009 December 31, 2010 $ $ 11.511 ASSETS Cash and Marketable Securities Accounts Receivable Inventory Other Currents Assets TOTAL CURRENT ASSETS 9.409 3,758 2,354 2,030 17,551 2,650 2,988 21,579 Long-Term Tangible Assets Long-Term Intangible Assets Other Long-Term Assets TOTAL LONG-TERM ASSETS TOTAL ASSETS 11.441 12,828 6,755 31,024 48,575 16,672 26,909 7,663 51,244 $ 72,823 $ $ $ LIABILITIES Accounts Payable Short-Term Debt Other Current Liabilities TOTAL CURRENT LIABILITIES 1.410 6,800 5,511 13,721 1,887 9,376 7.245 18,508 5,059 1,484 2,965 14,041 4,163 4.794 22,998 9,508 Long-Term Debt Deferred Taxes Other Long-Term Liabilities TOTAL LONG-TERM LIABILITIES SHAREHOLDERS' EQUITY Minority Interest Common Shareholders' Equity (2,303 and 2,292 million shares outstanding) TOTAL LIABILITIES AND SHAREHOLDERS' EQUITY 547 24,799 S48,575 314 31,003 $ 72,823 INCOME STATEMENT December 31, 2008 December 31, 2009 December 31, 2010 For the years ended SALES Cost of Goods Sold GROSS PROFIT Selling, General, and Administrative Other Operating Expenses OPERATING INCOME Other Income Other Expense Interest Income Interest Expense Minority Interest PRETAX INCOME Tax Expense Unusual Gains, Net of Unusual Losses NET INCOME $ 31,944 10,146 21,798 11,774 1,283 8,741 53 (1.976) 333 (438) 0 6,713 1,632 726 $ 5,807 $ 30,006 9,864 21,142 11,381 1,343 8,418 92 (253) 249 (341) (82) 8,083 2,040 781 $ 6,824 $ 35,200 11,234 23,966 13,179 1,703 9,084 5,312 (887) 317 (608) (50) 13,168 2,384 1,025 $ 11,809 Source: Capital IQ 3 This document is authorized for innhein CINC nin na Coca-Cola: Residual Income Valuation 113-056 Exhibit 2a Coca-Cola, Condensed Balance Sheet (in $ millions) January 1, 2011 As of January 1, 2009 January 1, 2010 $ $ $ 740 24,065 24,805 1,221 26,028 27,249 936 41,973 42.909 Beginning Net Working Capital Beginning Net Long-Term Assets NET OPERATING ASSETS Net Debt Preferred Stock Shareholders' Equity NET CAPITAL 4,333 0 20,472 $ 24,805 2,450 0 24,799 $ 27,249 11,906 0 31,003 $ 42,909 Exhibit 2b Coca-Cola, Condensed Income Statement (in $ millions) December 31, 2008 December 31, 2009 December 31, 2010 For the year ending $ 31.944 $ 31,006 $ 35,200 Sales NOPAT Net Interest Expense After Tax NET INCOME Less: Preferred Dividends NET INCOME TO COMMON SHAREHOLDERS 5,886 79 5,807 0 $ 5,807 6,892 69 6,824 0 6,824 12,047 238 11,809 0 11,809 $ $ Source: Casewriter Exhibit 3 Coca-Cola, Forecasting Assumptions Panel A. Cost of Capital Parameters Market Risk Premium Risk-Free Rate Tax Rate Cost of Debt Common Equity Beta 5.0% 3.0% 35.0% 4.5% 0.6 Panel B. Future Performance Forecasts 2011 10.0% 20.0% 2012 8.0% 20.0% 3.0% 105.0% Terminal 3.0% 15.0% 3.0% 100.0% Sales Growth Rate NOPAT/ Sales Beginning Net Operating Working Capital / Sales Beginning Net Operating Long-Term Assets / Sales Net Debt / Book Value of Net Capital Preferred Equity / Book Value of Net Capital Shareholders' Equity / Book Value of Net Capital Source: Casewriter 27.75% 0.0% 72.25% 27.75% 0.0% 72.25% 27.75% 0.0% 72.25%Step by Step Solution
There are 3 Steps involved in it
Step: 1

Get Instant Access to Expert-Tailored Solutions
See step-by-step solutions with expert insights and AI powered tools for academic success
Step: 2

Step: 3

Ace Your Homework with AI
Get the answers you need in no time with our AI-driven, step-by-step assistance
Get Started


