Use the link below to answer the questions
https://www.researchgate.net/publication/7585814_Risk_factors_for_hip_fractures_in_a_middle-aged_population_A_study_of_33000_men_and_women
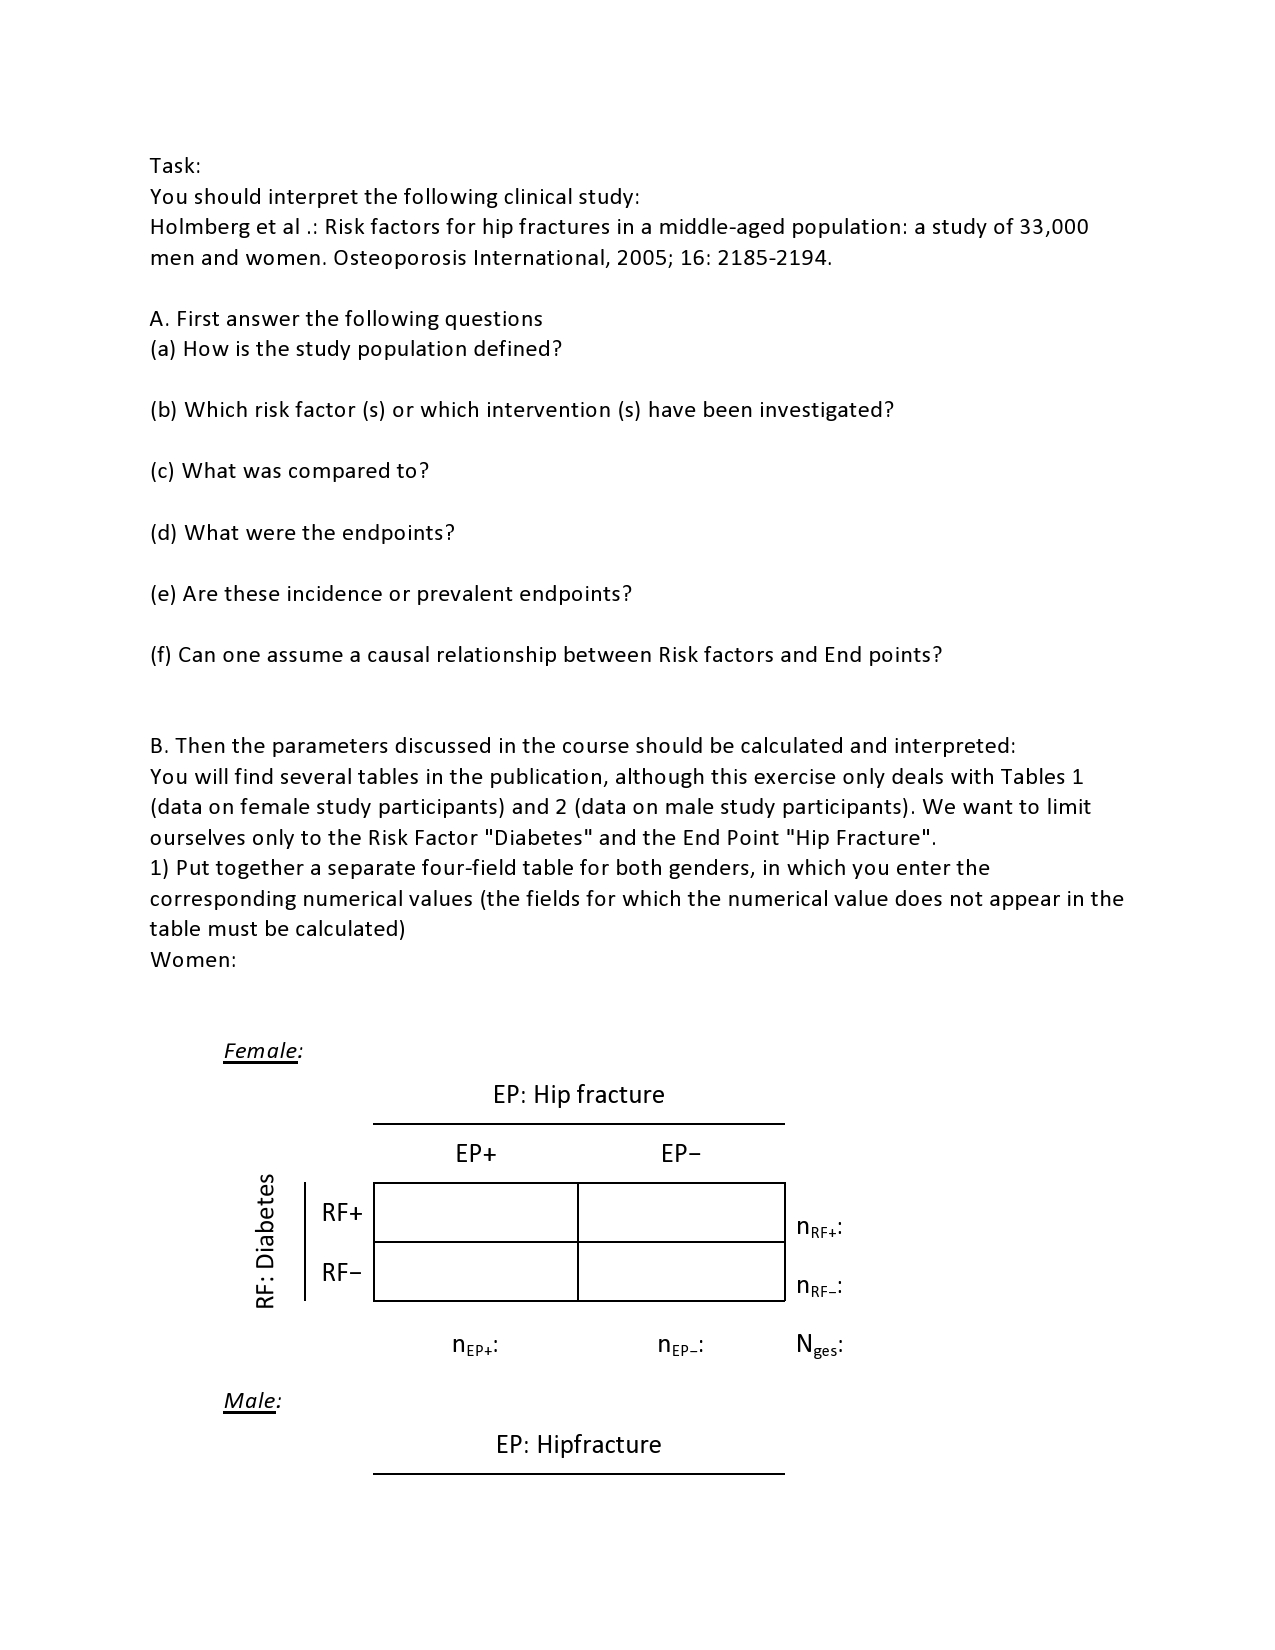
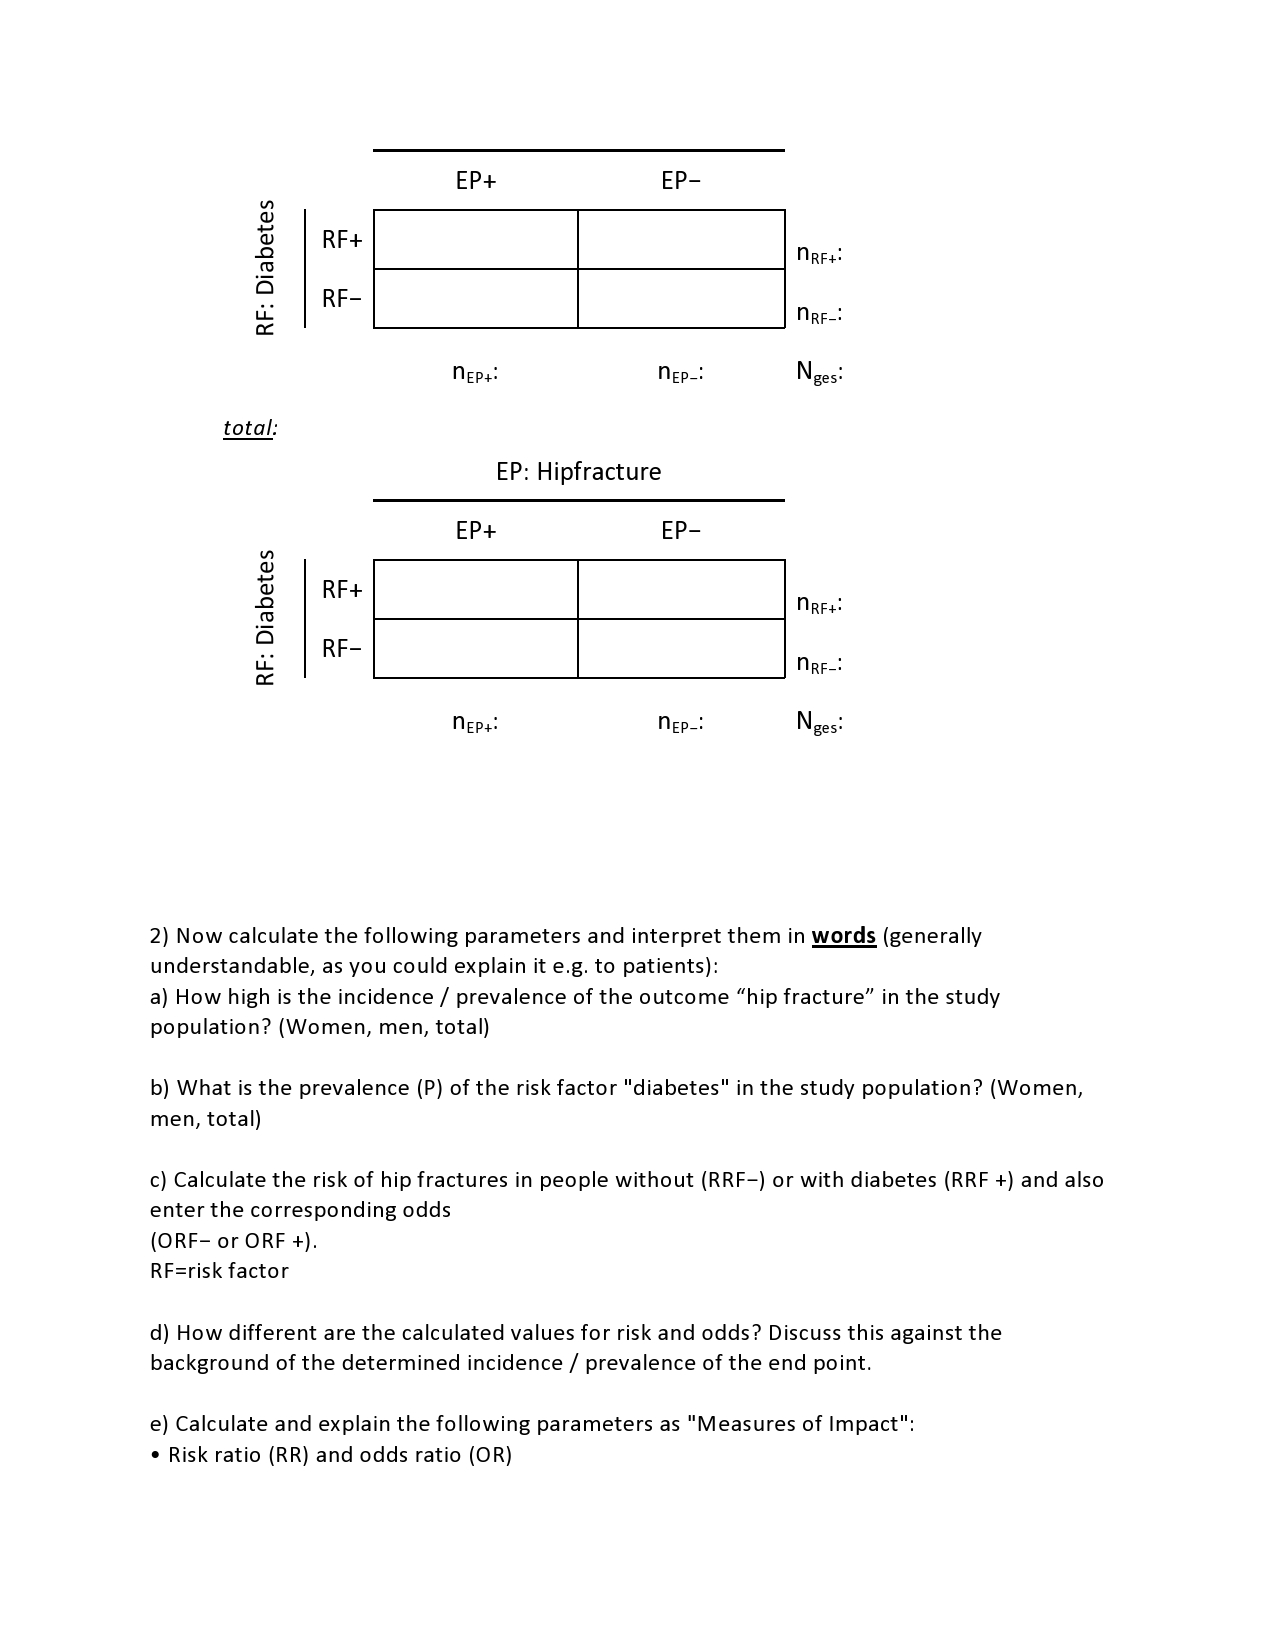
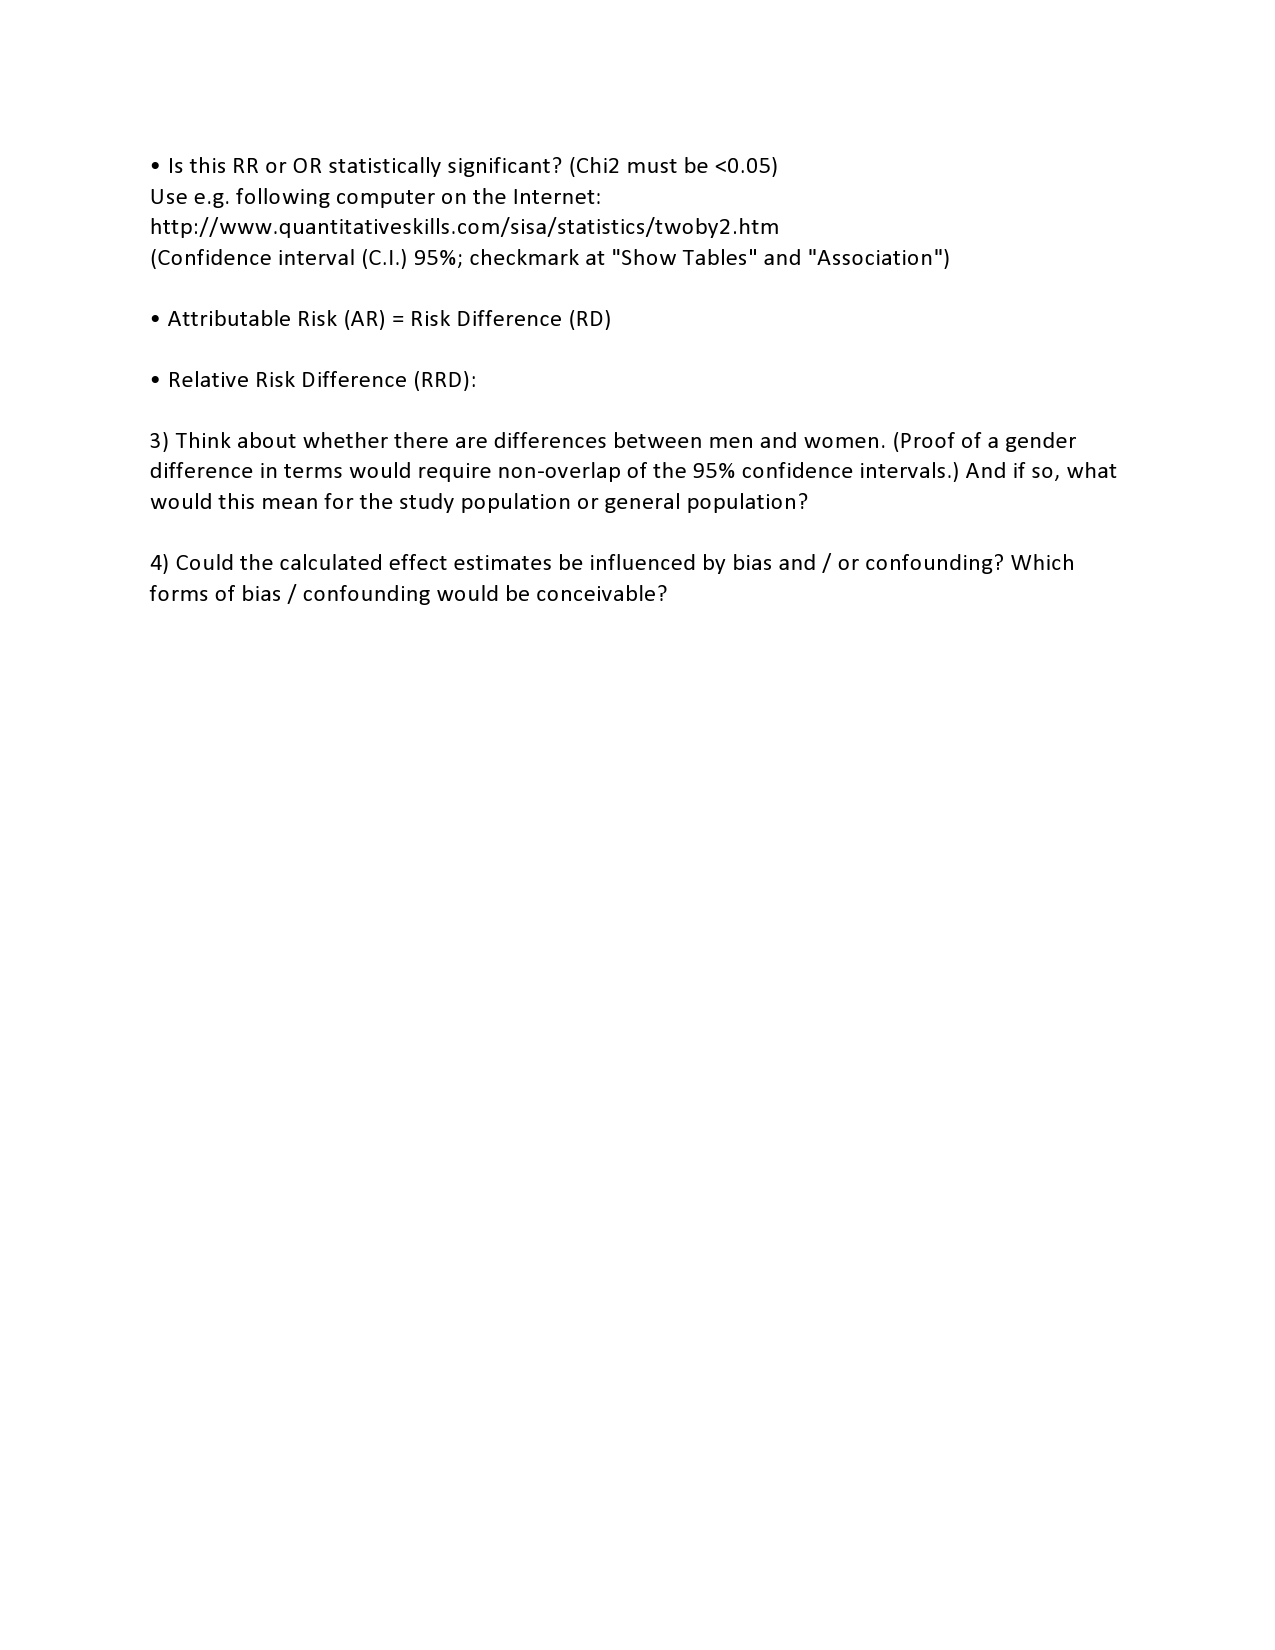
Task: You should interpret the following clinical study: Holmberg et al .: Risk factors for hip fractures in a middle-aged population: a study of 33,000 men and women. Osteoporosis International, 2005; 16: 2185-2194. A. First answer the following questions (a) How is the study population defined? {b} Which risk factor (5) or which intervention is) have been investigated? (c) What was compared to? {d} What were the endpoints? {e} Are these incidence or prevalent endpoints? {f} Can one assume a causal relationship between Risk factors and End points? B. Then the parameters discussed in the course should be calculated and interpreted: You will find several tables in the publication, although this exercise only deals with Tables 1 {data on female study participants} and 2 {data on male study participants). We want to limit ourselves only to the Risk Factor "Diabetes" and the End Point "Hip Fracture". 1} Put together a separate four-field table for both genders, in which you enter the corresponding numerical values (the fields for which the numerical value does not appear in the table must be calculated) Women: Female: EP: Hip fracture EP+ EP- V) 3 RF (D + E \"RH: 9 RF n . & RF- r.lEP+: nEP: Nges: Male: EP: Hipfracture EP+ EP- RF: Diabetes RF- nRF+: RF- nRF-: NEP+: nEP-: Nges: total: EP: Hipfracture EP+ EP- RF: Diabetes RF+ nRF+: RF- nRF-: NEP+: n EP-: Nges: 2) Now calculate the following parameters and interpret them in words (generally understandable, as you could explain it e.g. to patients): a) How high is the incidence / prevalence of the outcome "hip fracture" in the study population? (Women, men, total) b) What is the prevalence (P) of the risk factor "diabetes" in the study population? (Women, men, total) c) Calculate the risk of hip fractures in people without (RRF-) or with diabetes (RRF +) and also enter the corresponding odds (ORF- or ORF +). RF=risk factor d) How different are the calculated values for risk and odds? Discuss this against the background of the determined incidence / prevalence of the end point. e) Calculate and explain the following parameters as "Measures of Impact": . Risk ratio (RR) and odds ratio (OR). Is this RR or 0R statistically significant? {Chi2 must be 40.05) Use e.g. following computer on the Internet: http://www.quantitativeskills.com/sisa/statistics/twoby2.htm {Confidence interval {CL} 95%; checkmark at "Show Tables" and "Association"} - Attributable Risk (AR) = Risk Difference (RD) . Relative Risk Difference (RRD): 3} Think about whether there are differences between men and women. [Proof of a gender difference in terms would require non-overlap of the 95% confidence intervals.) And if so, what would this mean for the study population or general population? 4} Could the calculated effect estimates be influenced by bias and / or confounding? Which forms of bias / confounding would be conceivable


