Answered step by step
Verified Expert Solution
Question
1 Approved Answer
Use the Mathlab cobweb program below for plotting, you will need to change one line in the program. function [] = cobweb_model(P0,K,L,N,xmax); % % The

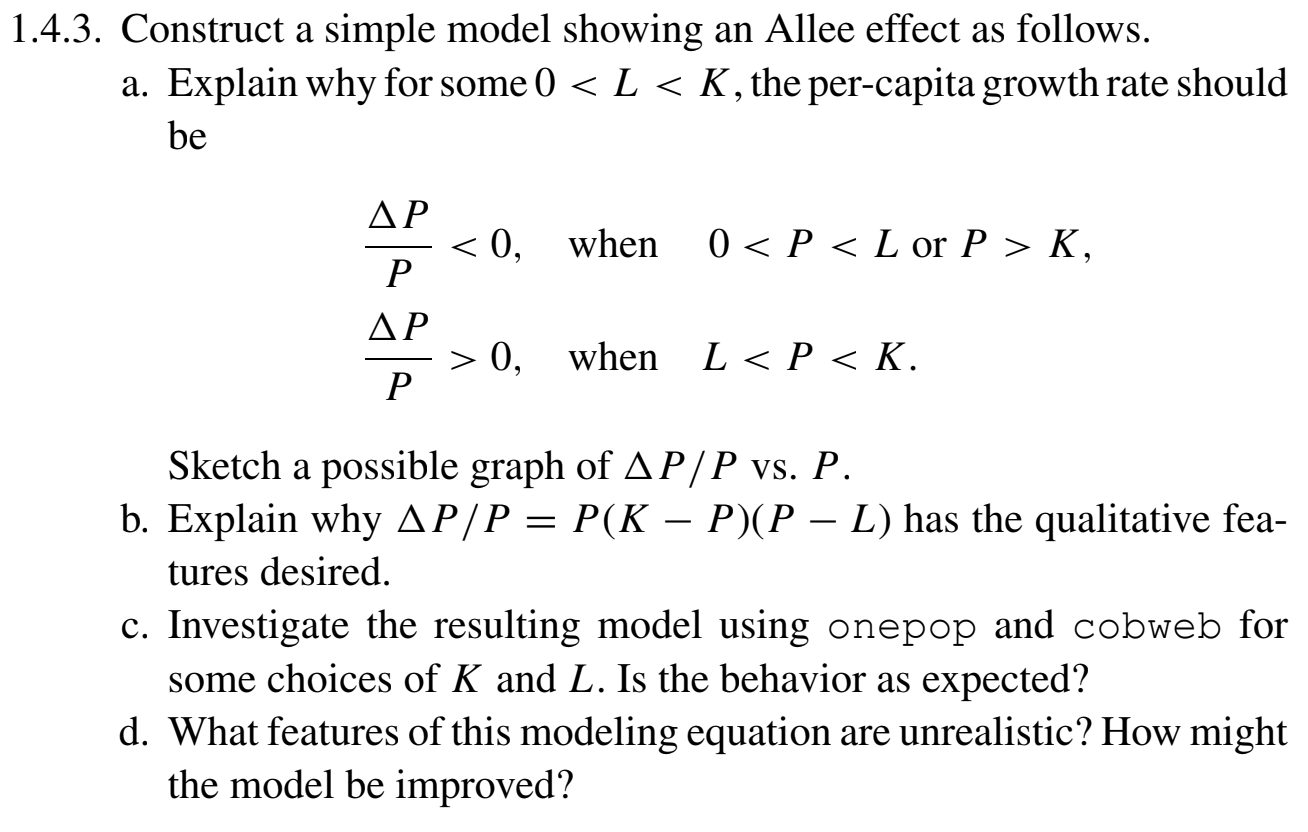
Use the Mathlab cobweb program below for plotting, you will need to change one line in the program. function [] = cobweb_model(P0,K,L,N,xmax); % % The function calculates N generation with the initial % population P0 and your model with parameters % K and L. Then a cobweb graph is drawn. % % xmax is the maximum x-value that will be plotted. % T=0:N; % Generate N generations. P(1)=P0; for i=1:N P(i+1) = L(P(i),K,r); end % Values for diagonal and function plot x = (0:1000)/1000*xmax; y = L(x,K,r); % Generate data for cobweb for i=1:N xc(2*i-1) = P(i); yc(2*i-1) = P(i); xc(2*i) = P(i); yc(2*i) = P(i+1); end yc(1) = 0; % First one starts at the x-axis % Plot plot(x,x,'-r',x,y,'-b',xc,yc,'-g'); ylim([0,max(max(P(2:N+1))+1,max(y)+1)]); xlabel('Population P_{t-1}'); ylabel('Population P_{t}'); temp = ['$P_0=$' num2str(P0) ', initial growth rate $r=$' num2str(r) ', Capacity ' num2str(K) ', ' num2str(N) ' time steps']; T = title({'\textbf{Cobweb for your Model}',temp}); set(T,'Interpreter','latex'); end % Your mapping function [y] = L(x,K,L) y = x.*exp(r*(1-x./K)); % You neeed to change this line to run your won model. end 1.4.3. Construct a simple model showing an Allee effect as follows. a. Explain why for some 0) K, ->0, when LK, ->0, when L
Step by Step Solution
There are 3 Steps involved in it
Step: 1

Get Instant Access to Expert-Tailored Solutions
See step-by-step solutions with expert insights and AI powered tools for academic success
Step: 2

Step: 3

Ace Your Homework with AI
Get the answers you need in no time with our AI-driven, step-by-step assistance
Get Started


