Use the most recent year, thank you
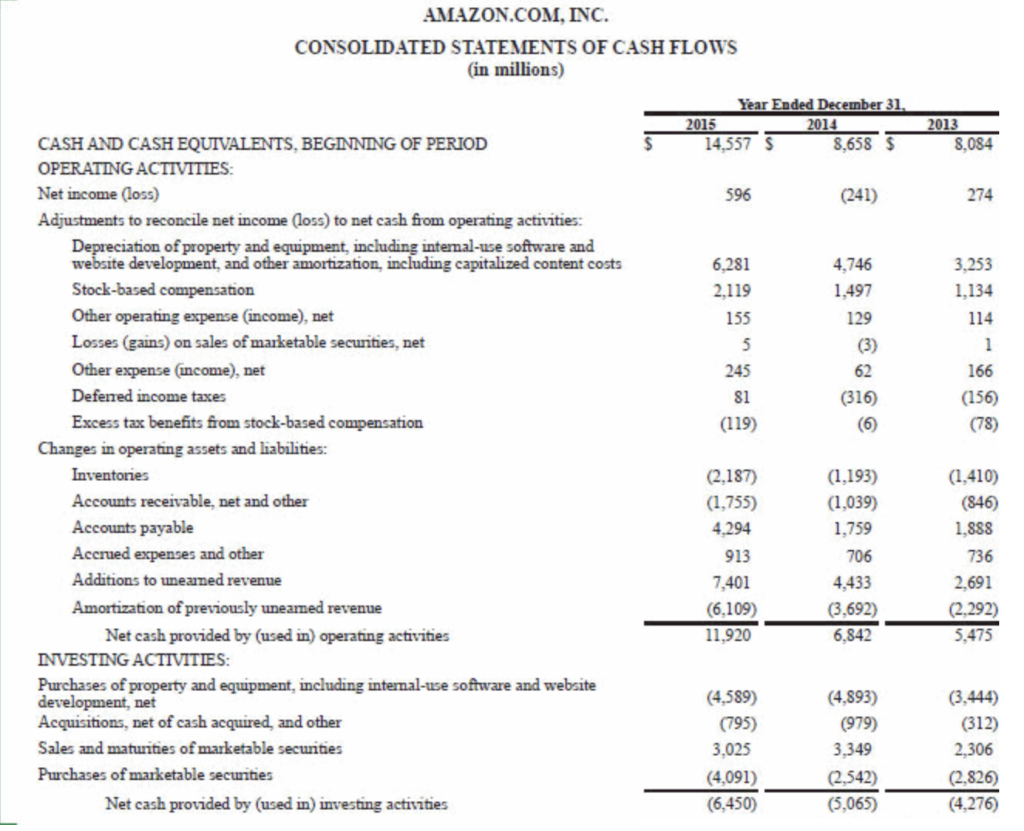
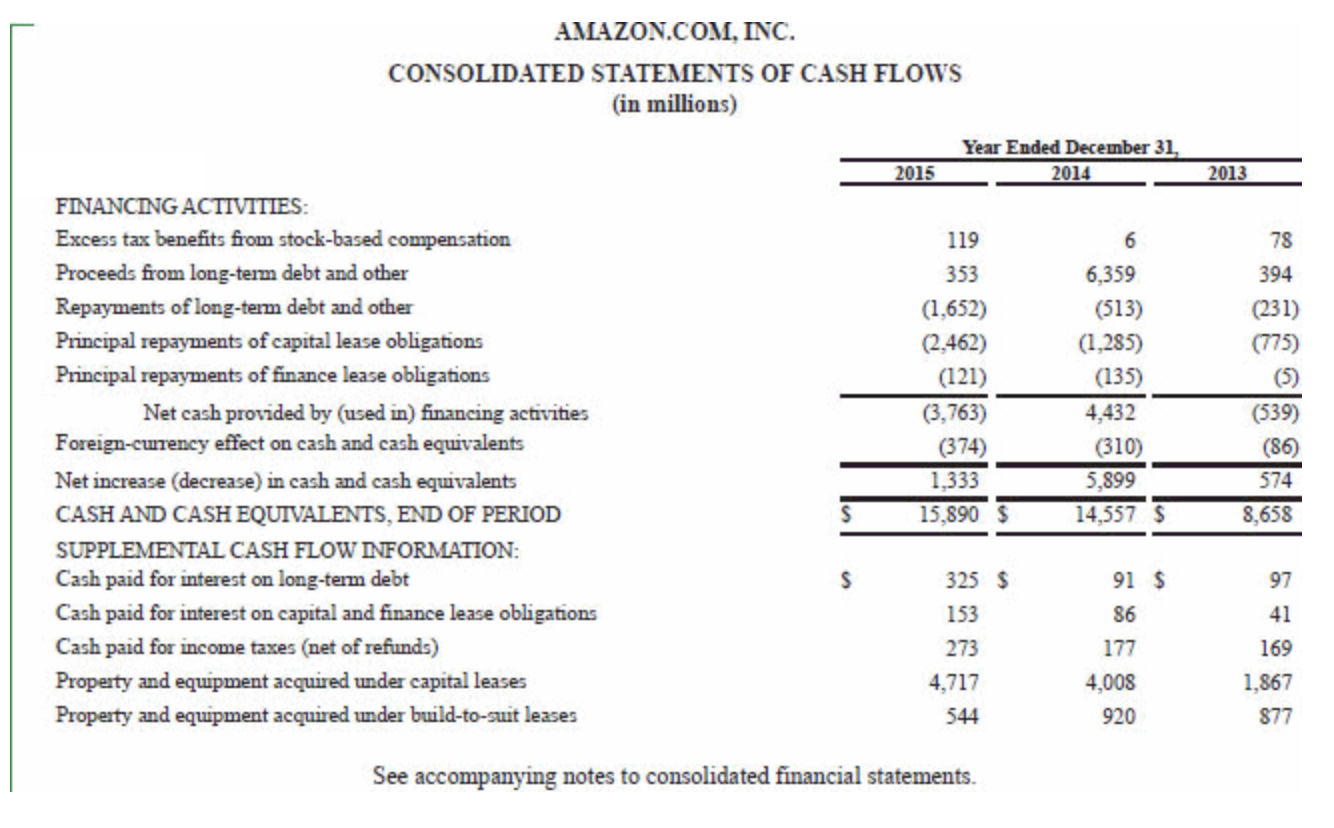
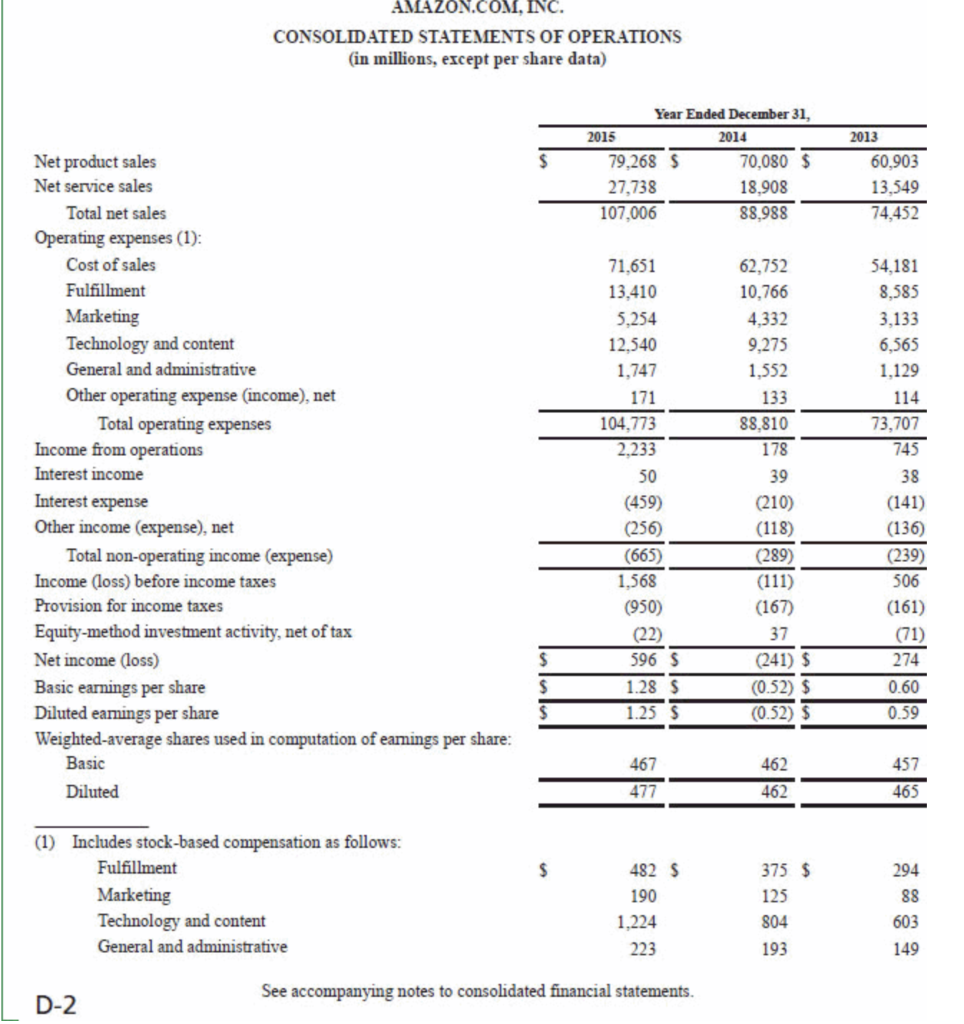
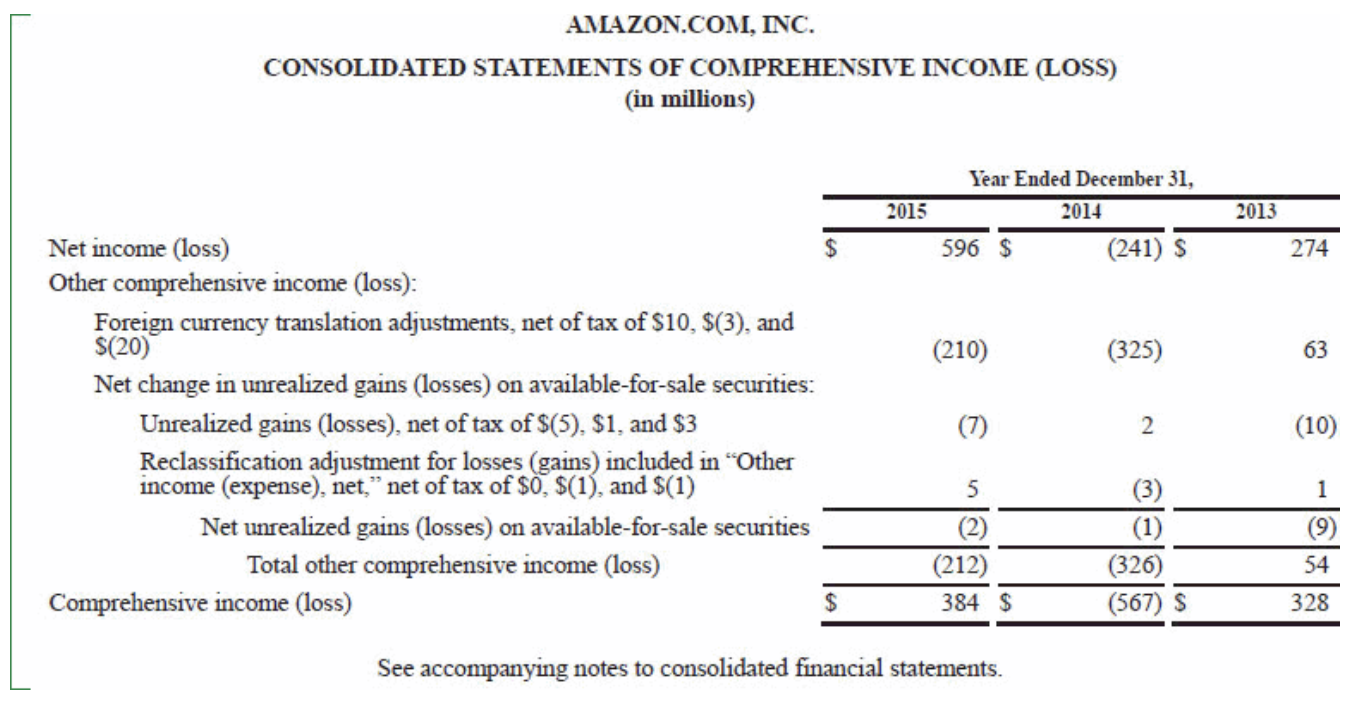
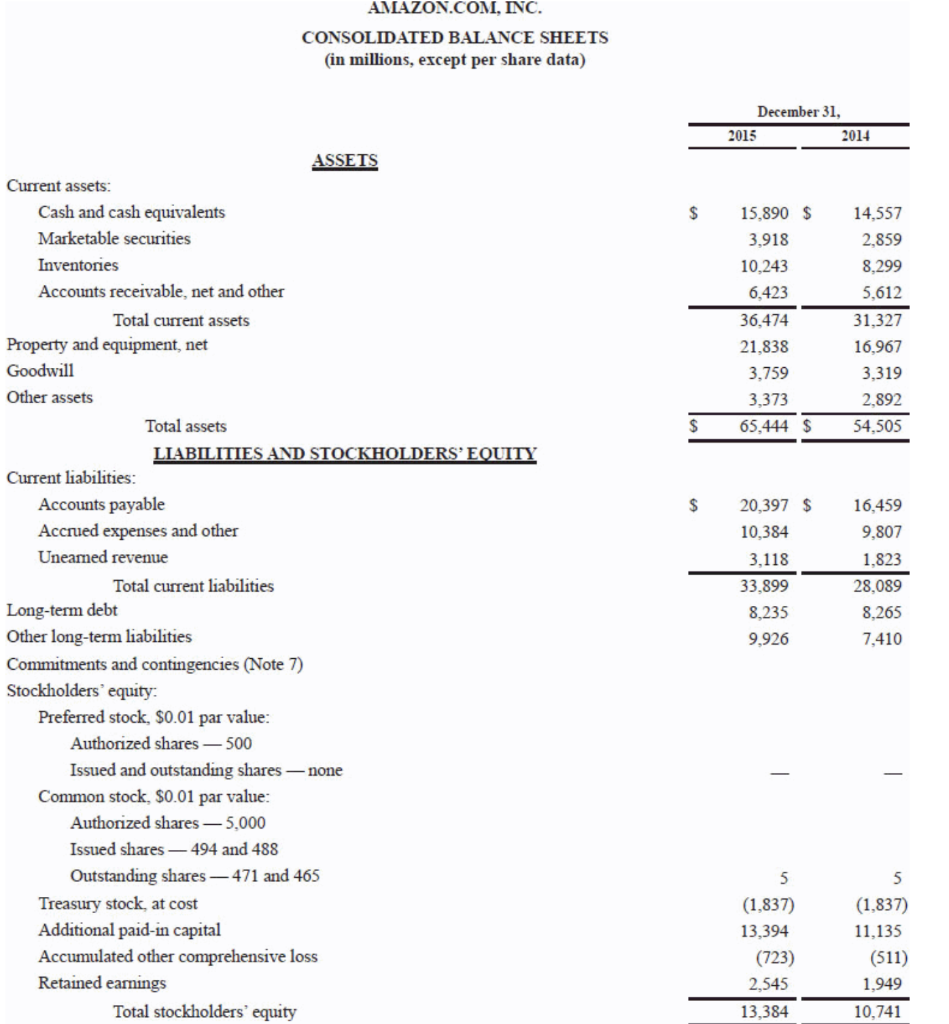
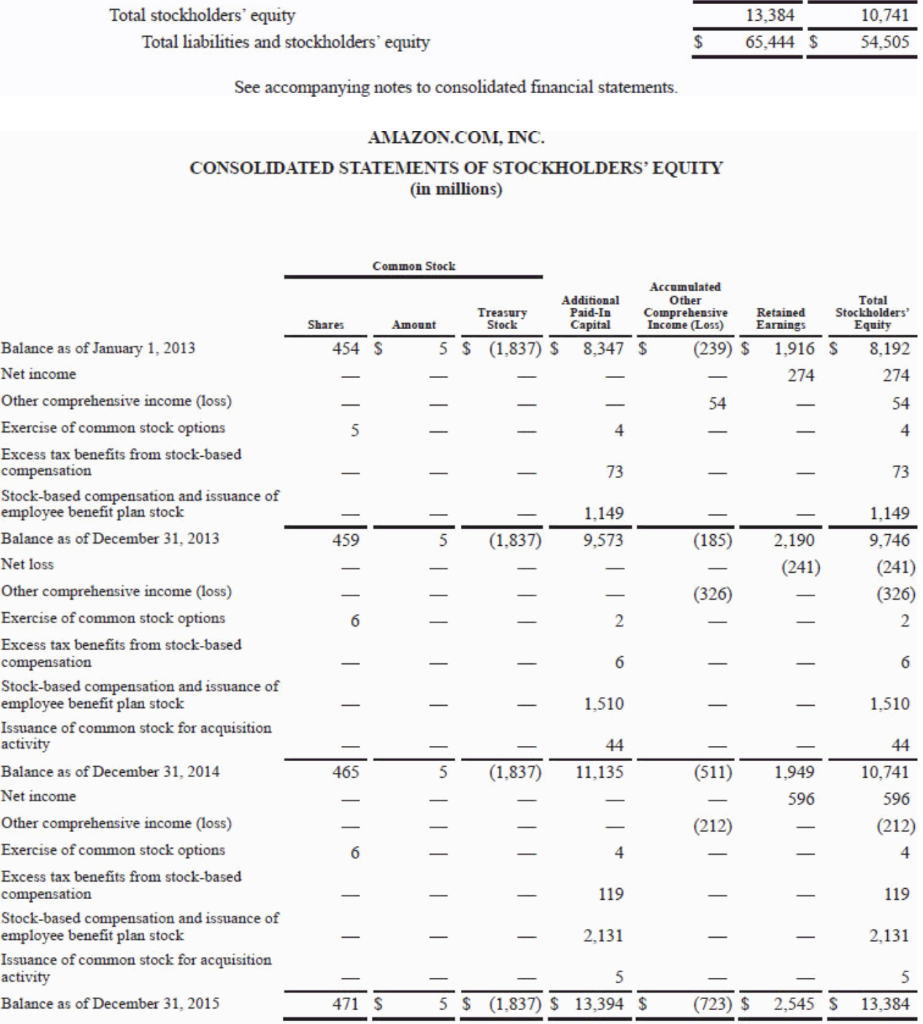
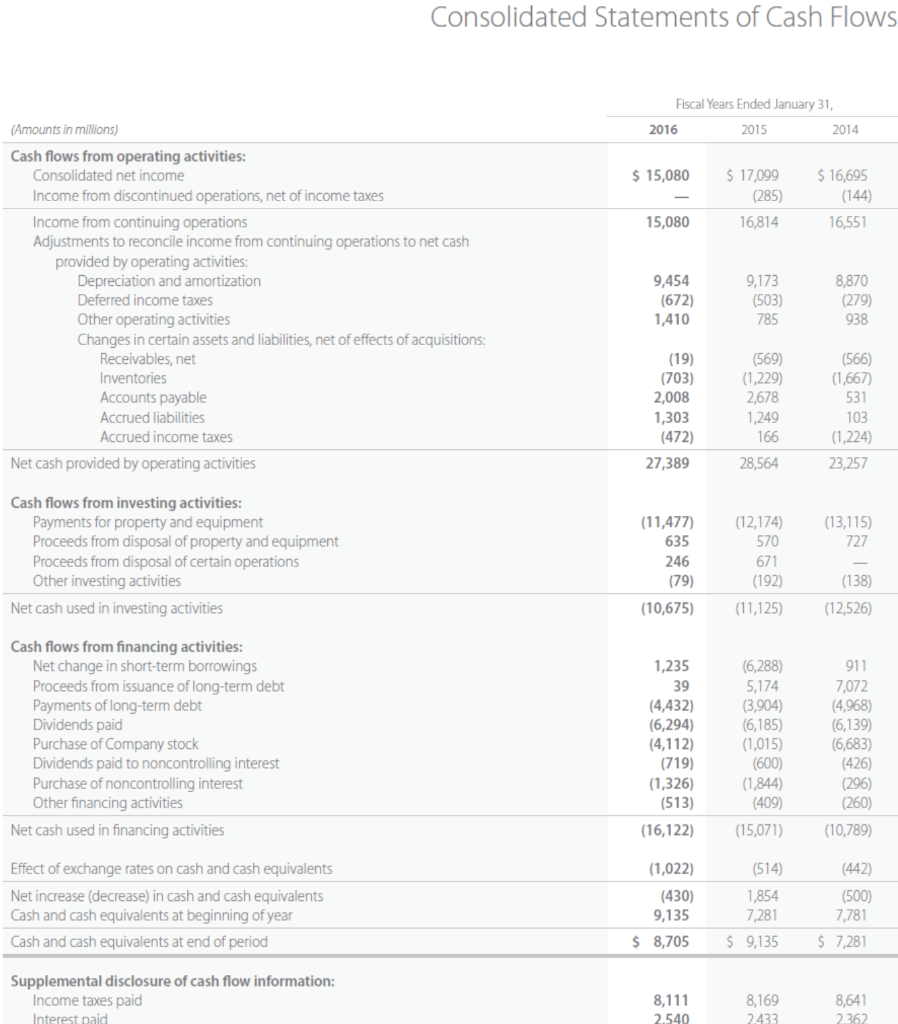
Expand Your Critical Thinking 9-03 Amazon.com, Inc.'s financial statements are presented in Appendix D. Click here to view Appendix D. Financial statements of Wal-Mart Stores, Inc. are presented in Appendix E. Click here to view Appendix E. Instructions for accessing and using the complete annual reports of Amazon and Wal-Mart, including the notes to the financial statements, are also provided in Appendices D and E, respectively. (a) Compute the asset turnover for each company using the financial statements in Appendices D and E. (Round answers to 2 decimal places, e.g. 15.25.) Amazon Wal-Mart Asset turnover ratio times times Amazon.com, Inc.'s financial statements are presented in Appendix D. Click here to view Appendix D. Financial statements of Wal-Mart Stores, Inc. are presented in Appendix E. Click here to view Appendix E. Instructions for accessing and using the complete annual reports of Amazon and Wal-Mart, including the notes to the financial statements, are also provided in Appendices D and E, respectively. (a) At December 31, 2015, what was Amazon's largest current liability account? What were its total current liabilities? At January 31, 2016, what was Wal-Mart's largest current liability account? What were its total current liabilities? Amazon Wal-Mart Largest current liability million million at $ at $ Total current liabilities million million $ AMAZON.COM, INC. CONSOLIDATED STATEMENTS OF CASH FLOWS (in millions) Year Ended December 31. 2015 2014 14,557 5 8,658 5 2013 8,084 596 (241) 274 4,746 1,497 129 6.281 2.119 155 5 245 81 (119) 3,253 1,134 114 1 166 (156) (78) 62 (316) CASH AND CASH EQUIVALENTS, BEGINNING OF PERIOD OPERATING ACTIVITIES: Net income (loss) Adjustments to reconcile net income (loss) to net cash from operating activities: Depreciation of property and equipment, including internal-use software and website development, and other amortization, including capitalized content costs Stock-based compensation Other operating expense (income), net Losses (gains) on sales of marketable securities, net Other expense (income), net Deferred income taxes Excess tax benefits from stock-based compensation Changes in operating assets and liabilities: Inventories Accounts receivable, net and other Accounts payable Accrued expenses and other Additions to uneamed revenue Amortization of previously uneamed revenue Net cash provided by (used in) operating activities INVESTING ACTIVITIES: Purchases of property and equipment, including internal-use software and website development, net Acquisitions, net of cash acquired, and other Sales and maturities of marketable securities Purchases of marketable securities Net cash provided by (used in) investing activities (2,187) (1,755) 4.294 913 7,401 (6.109) (1.193) (1,039) 1,759 706 4,433 (3,692) 6,842 (1,410) (846) 1.888 736 2,691 (2.292) 5,475 11.920 (4.589) (795) 3,025 (4,091) (6,450) (4,893) (979) 3,349 (2,542) (5,065) (3,444) (312) 2,306 (2,826) (4,276) AMAZON.COM, INC. CONSOLIDATED STATEMENTS OF CASH FLOWS (in millions) Year Ended December 31, 2014 2015 2013 78 FINANCING ACTIVITIES: Excess tax benefits from stock-based compensation Proceeds from long-term debt and other Repayments of long-term debt and other Principal repayments of capital lease obligations Principal repayments of finance lease obligations Net cash provided by (used in) financing activities Foreign-currency effect on cash and cash equivalents Net increase (decrease) in cash and cash equivalents CASH AND CASH EQUIVALENTS, END OF PERIOD SUPPLEMENTAL CASH FLOW INFORMATION: Cash paid for interest on long-term debt Cash paid for interest on capital and finance lease obligations Cash paid for income taxes (net of refunds) Property and equipment acquired under capital leases Property and equipment acquired under build-to-suit leases 119 353 (1,652) (2.462) (121) (3,763) (374) 1,333 15,890 $ 6 6,359 (513) (1,285) (135) 4,432 (310) 5,899 14,557 $ 394 (231) (775) (5) (539) (86) 574 8,658 325 $ 153 273 4,717 544 91 $ 86 177 4,008 920 97 41 169 1.867 877 See accompanying notes to consolidated financial statements. AMAZON.COM, INC. CONSOLIDATED STATEMENTS OF OPERATIONS (in millions, except per share data) 2015 $ Year Ended December 31, 2014 79,268 $ 70,080 $ 27,738 18,908 107,006 88.988 2013 60,903 13,549 74,452 Net product sales Net service sales Total net sales Operating expenses (1): Cost of sales Fulfillment Marketing Technology and content General and administrative Other operating expense (income), net Total operating expenses Income from operations Interest income Interest expense Other income (expense), net Total non-operating income (expense) Income (loss) before income taxes Provision for income taxes Equity-method investment activity, net of tax Net income (loss) Basic earnings per share Diluted earnings per share Weighted-average shares used in computation of eamings per share: Basic Diluted 71,651 13,410 5.254 12,540 1.747 171 104,773 2,233 50 (459) (256) (665) 1,568 (950) (22) 596 $ 1.28 $ 1.25 $ 62,752 10,766 4.332 9,275 1,552 133 88.810 178 39 (210) (118) (289) (111) (167) 37 (241) $ (0.52) $ (0.52) $ 54,181 8,585 3,133 6,565 1,129 114 73,707 745 38 (141) (136) (239) 506 (161) (71) 274 $ $ 0.60 0.59 $ 467 477 462 462 457 465 $ (1) Includes stock-based compensation as follows: Fulfillment Marketing Technology and content General and administrative 482 $ 190 1,224 223 375 $ 125 804 193 294 88 603 149 See accompanying notes to consolidated financial statements. D-2 AMAZON.COM, INC. CONSOLIDATED STATEMENTS OF COMPREHENSIVE INCOME (LOSS) (in millions) 2015 Year Ended December 31, 2014 596 $ (241) S 2013 274 (210) (325) 63 Net income (loss) Other comprehensive income (loss): Foreign currency translation adjustments, net of tax of $10, $(3), and $(20) Net change in unrealized gains (losses) on available-for-sale securities: Unrealized gains (losses), net of tax of $(5), $1, and $3 Reclassification adjustment for losses (gains) included in Other income (expense), net, net of tax of $0, $(1), and $(1) Net unrealized gains (losses) on available-for-sale securities Total other comprehensive income (loss) Comprehensive income (loss) 2. (10) 5 (3) 1 (2) (212) 384 $ (9) 54 (326) $ (567) $ 328 See accompanying notes to consolidated financial statements. AMAZON.COM, INC. CONSOLIDATED BALANCE SHEETS (in millions, except per share data) December 31, 2015 2014 $ 15,890 $ 3,918 10,243 6,423 36,474 21.838 3,759 3,373 65,444 $ 14,557 2,859 8,299 5,612 31,327 16.967 3,319 2,892 54,505 $ $ ASSETS Current assets: Cash and cash equivalents Marketable securities Inventories Accounts receivable, net and other Total current assets Property and equipment, net Goodwill Other assets Total assets LIABILITIES AND STOCKHOLDERS' EQUITY Current liabilities: Accounts payable Accrued expenses and other Uneamed revenue Total current liabilities Long-term debt Other long-term liabilities Commitments and contingencies (Note 7) Stockholders' equity: Preferred stock, $0.01 par value: Authorized shares 500 Issued and outstanding shares none Common stock, $0.01 par value: Authorized shares 5,000 Issued shares 494 and 488 Outstanding shares 471 and 465 Treasury stock, at cost Additional paid-in capital Accumulated other comprehensive loss Retained earnings Total stockholders' equity 20,397 $ 10.384 3.118 33,899 8.235 9,926 16,459 9,807 1.823 28.089 8,265 7,410 5 (1,837) 13,394 (723) 2,545 13,384 (1.837) 11,135 (511) 1,949 10.741 Total stockholders' equity Total liabilities and stockholders' equity 13,384 65.444 $ 10,741 54,505 See accompanying notes to consolidated financial statements. AMAZON.COM, INC. CONSOLIDATED STATEMENTS OF STOCKHOLDERS' EQUITY (in millions) Common Stock Accumulated Additional Other Total Treasury Paid-In Comprehensive Retained Stockholders' Shares Amount Stock Capital Income (Loss) Equity 454 S 5 $ (1,837) $ 8,347 $ (239) $ 1,916 S 8,192 274 274 Earnings lin ||| 54 54 4 4 73 73 1.149 9,573 459 (1,837) (185) 2.190 (241) 1.149 9,746 (241) (326) 2 (326) 6 2 6 6 Balance as of January 1, 2013 Net income Other comprehensive income (loss) Exercise of common stock options Excess tax benefits from stock-based compensation Stock-based compensation and issuance of employee benefit plan stock Balance as of December 31, 2013 Net loss Other comprehensive income (loss) Exercise of common stock options Excess tax benefits from stock-based compensation Stock-based compensation and issuance of employee benefit plan stock Issuance of common stock for acquisition activity Balance as of December 31, 2014 Net income Other comprehensive income (loss) Exercise of common stock options Excess tax benefits from stock-based compensation Stock-based compensation and issuance of employee benefit plan stock Issuance of common stock for acquisition activity Balance as of December 31, 2015 1,510 1,510 44 465 (1,837) 11,135 (511) 1.949 596 44 10,741 596 (212) (212) 6 4 4 119 119 - 2,131 - 2.131 5 5 $ (1.837) $ 13,394 $ 5 13,384 471 S (723) $ 2,545 S (The following are Wal-Mart Stores, Inc.'s financial statements as presented in the company's 2016 annual report. To access Wal-Mart's complete annual report, including notes to the financial statements, follow these steps:1. Go to https://corporate.walmart.com. 2.Select Financial Information under the Investors tab. 3.Select Annual Reports & Proxies, then select the 2016 Annual Report (Wal-Mart's fiscal year ends January 31). 4.The Notes to Consolidated Financial Statements begin on page 40.) Consolidated Statements of Income Fiscal Years Ended January 31, 2016 2015 2014 $478,614 3,516 482,130 $482,229 3,422 485,651 $473,076 3,218 476,294 360,984 97,041 24,105 365,086 93,418 27,147 358,069 91,353 26,872 2,027 521 (81) 2,467 21,638 2,161 300 (113) 2,072 263 (119) 2,216 24,656 2,348 24,799 (Amounts in millions, except per share data) Revenues: Net sales Membership and other income Total revenues Costs and expenses: Cost of sales Operating, selling, general and administrative expenses Operating income Interest: Debt Capital lease and financing obligations Interest income Interest, net Income from continuing operations before income taxes Provision for income taxes: Current Deferred Total provision for income taxes Income from continuing operations Income from discontinued operations, net of income taxes Consolidated net income Consolidated net income attributable to noncontrolling interest Consolidated net income attributable to Walmart Basic net income per common share: Basic income per common share from continuing operations attributable to Walmart Basic income per common share from discontinued operations attributable to Walmart Basic net income per common share attributable to Walmart Diluted net income per common share: Diluted income per common share from continuing operations attributable to Walmart Diluted income per common share from discontinued operations attributable to Walmart Diluted net income per common share attributable to Walmart Weighted average common shares outstanding: Basic Diluted 7,584 (1,026) 6,558 15,080 8,504 (519) 7,985 16,814 285 17,099 (736) 8,619 (514) 8,105 16,551 144 16,695 (673) 15,080 (386) $ 14,694 $ 16,363 $ 16,022 $ 4.58 $ 5.01 0.06 $ 4.87 0.03 $ 4.58 $ 5.07 $ 4.90 $ 4.57 $ $ 4.99 0.06 485 0.03 4.88 $ 4.57 $ 5.05 $ 3,207 3,217 3,230 3,243 3,269 3,283 Diluted 3,217 3,243 3,283 Dividends declared per common share $ 1.96 $ 1.92 $ 1.88 See accompanying notes (Amounts in millions) Consolidated net income Less consolidated net income attributable to nonredeemable noncontrolling interest Less consolidated net income attributable to redeemable noncontrolling interest Consolidated net income attributable to Walmart Fiscal Years Ended January 31, 2016 2015 2014 $15,080 $17,099 $16,695 (386) (736) (606) (67) 14,694 16,363 16,022 (5,220) 366 (202) 86 (4,558) 379 (470) (69) (4,718) 546 Other comprehensive income (loss), net of income taxes Currency translation and other Net investment hedges Cash flow hedges Minimum pension liability Other comprehensive income (loss), net of income taxes Less other comprehensive income (loss) attributable to nonredeemable noncontrolling interest Less other comprehensive income (loss) attributable to redeemable noncontrolling interest Other comprehensive income (loss) attributable to Walmart Comprehensive income, net of income taxes Less comprehensive income (loss) attributable to nonredeemable noncontrolling interest Less comprehensive income (loss) attributable to redeemable noncontrolling interest Comprehensive income attributable to Walmart (3,221) 75 207 153 (2,786) 311 66 (4,970) 541 (4,429) 10,110 155 (4,172) 12,381 (190) (2,409) 13,909 (295) (1) $13,613 $10,265 $12,191 See accompanying notes Consolidated Balance Sheets Fiscal Years Ended January 31, (Amounts in millions) 2016 2015 $ 8,705 5,624 44,469 1,441 $ 9,135 6,778 45,141 2,224 60,239 63,278 ASSETS Current assets: Cash and cash equivalents Receivables, net Inventories Prepaid expenses and other Total current assets Property and equipment: Property and equipment Less accumulated depreciation Property and equipment, net Property under capital lease and financing obligations: Property under capital lease and financing obligations Less accumulated amortization 176,958 (66,787) 110,171 177,395 (63,115) 114,280 11,096 14.751) 5,239 (2864) Less accumulated amortization Property under capital lease and financing obligations, net Goodwill Other assets and deferred charges Total assets (4,751) 6,345 16,695 6,131 $199,581 (2,864) 2,375 18,102 5,455 $203,490 LIABILITIES AND EQUITY Current liabilities: Short-term borrowings Accounts payable Accrued liabilities Accrued income taxes Long-term debt due within one year Capital lease and financing obligations due within one year Total current liabilities $ 2,708 38,487 19,607 521 2,745 551 $ 1,592 38,410 19,152 1,021 4,791 287 65,253 64,619 Long-term debt Long-term capital lease and financing obligations Deferred income taxes and other 38,214 5,816 7,321 40,889 2,606 8,805 Commitments and contingencies Equity: Common stock Capital in excess of par value Retained earnings Accumulated other comprehensive income (loss) Total Walmart shareholders' equity Nonredeemable noncontrolling interest Total equity Total liabilities and equity 317 1,805 90,021 (11,597) 80,546 3,065 323 2,462 85,777 (7,168) 81,394 4,543 83,611 $199,581 85,937 $203,490 See accompanying notes. Consolidated Statements of Shareholders' Equity and Redeemable Noncontrolling Interest Accumulated Total Other Walmart Comprehensive Shareholders' Income (Loss) Equity $ (587) $ 76,343 16,022 Nonredeemable Noncontrolling Interest Retained Earnings $72,978 16,022 Total Equity $ 81,738 16,617 Redeemable Noncontrolling Interest $ 519 78 $ 5,395 595 (2,409) (2,409) (311) (2,720) (66) 1 (6,139) (6,254) (6,139) (6,557) (6,139) (6,557) (1,019) 14 (1,019) (581) 1,019 (59) (41) (595) (2,996) 1,491 76,566 16,363 76,255 16,363 5,084 736 81,339 17,099 (4,172) (4,172) (546) (4,718) Capital in Common Stock Excess of (Amounts in millions) Shares Amount Par Value Balances as of February 1, 2013 3,314 $332 $3,620 Consolidated net income Other comprehensive income, net of income taxes - Cash dividends declared ($1.88 per share) Purchase of Company stock (87) (9) (294) Redemption value adjustment of redeemable noncontrolling interest (1,019) Other 6 55 Balances as of January 31, 2014 3,233 323 2,362 Consolidated net income Other comprehensive loss, net of income taxes - - Cash dividends declared ($1.92 per share) Purchase of Company stock (13) (1) Purchase of redeemable noncontrolling interest Other 129 Balances as of January 31, 2015 3,228 323 2,462 Consolidated net income Other comprehensive income, net of income taxes - - - Cash dividends declared ($1.96 per share) Purchase of Company stock (65) (6) (102) Cash dividend declared to noncontrolling interest - Other (1) (555) Balances as of January 31, 2016 3,162 $317 $1,805 (6,185) (950) (6,185) (980) (6,185) (980) (29) 11 (1,491) 00 1 (17) 85,777 14,694 (7,168) 113 81,394 14,694 (731) 4,543 386 (618) 85,937 15,080 - (4,429) (4,429) (541) (4,970) (6,294) (4,148) (6,294) (4,256) (6,294) (4,256) (691) (632) (8) $90,021 (563) $80,546 (691) (1,195) $83,611 $(11,597) $3,065 $ See accompanying notes. Consolidated Statements of Cash Flows Fiscal Years Ended January 31, 2016 2015 2014 $ 15,080 $ 17,099 (285) 16,814 $ 16,695 (144) 16,551 15,080 (Amounts in millions) Cash flows from operating activities: Consolidated net income Income from discontinued operations, net of income taxes Income from continuing operations Adjustments to reconcile income from continuing operations to net cash provided by operating activities: Depreciation and amortization Deferred income taxes Other operating activities Changes in certain assets and liabilities, net of effects of acquisitions: Receivables, net Inventories Accounts payable Accrued liabilities Accrued income taxes Net cash provided by operating activities 9,454 (672) 1,410 9,173 (503) 785 8,870 (279) 938 (19) (703) 2,008 1,303 (472) 27,389 (569) (1,229) 2,678 1,249 166 (566) (1,667) 531 103 (1,224) 23,257 28,564 (13,115) 727 Cash flows from investing activities: Payments for property and equipment Proceeds from disposal of property and equipment Proceeds from disposal of certain operations Other investing activities Net cash used in investing activities (11,477) 635 246 (79) (10,675) (12,174) 570 671 (192) (11,125) (138) (12,526) Cash flows from financing activities: Net change in short-term borrowings Proceeds from issuance of long-term debt Payments of long-term debt Dividends paid Purchase of Company stock Dividends paid to noncontrolling interest Purchase of noncontrolling interest Other financing activities Net cash used in financing activities 1,235 39 (4,432) (6,294) (4,112) (719) (1,326) (513) (16,122) (6,288) 5,174 (3,904) (6,185) (1,015) (600) (1,844) (409) (15,071) 911 7,072 (4,968) (6,139) (6,683) (426) (296) (260) (10,789) (1,022) Effect of exchange rates on cash and cash equivalents Net increase (decrease) in cash and cash equivalents Cash and cash equivalents at beginning of year Cash and cash equivalents at end of period (430) (514) 1,854 7,281 $ 9,135 (442) (500) 7,781 $ 7,281 9,135 $ 8,705 Supplemental disclosure of cash flow information: Income taxes paid Interest paid 8,111 2.540 8,169 2433 8,641 2362