Answered step by step
Verified Expert Solution
Link Copied!

Question

1 Approved Answer

Use the plot cmd to plot the function called the Folium of Descarte, given by the following parametric equation, x=1+t34t,y=1+t34t2 Plot the function using two
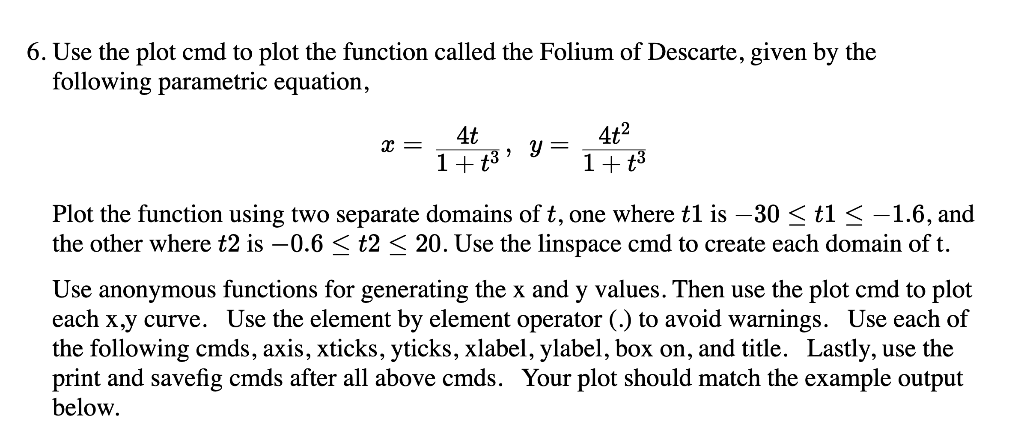
image text in transcribed

Use the plot cmd to plot the function called the Folium of Descarte, given by the following parametric equation, x=1+t34t,y=1+t34t2 Plot the function using two separate domains of t, one where t1 is 30t11.6, and the other where t2 is 0.6t220. Use the linspace cmd to create each domain of t. Use anonymous functions for generating the x and y values. Then use the plot cmd to plot each x,y curve. Use the element by element operator (.) to avoid warnings. Use each of the following cmds, axis, xticks, yticks, xlabel, ylabel, box on, and title. Lastly, use the print and savefig cmds after all above cmds. Your plot should match the example output below

Step by Step Solution

There are 3 Steps involved in it

Step: 1

blur-text-image

Get Instant Access to Expert-Tailored Solutions

See step-by-step solutions with expert insights and AI powered tools for academic success

Step: 2

blur-text-image

Step: 3

blur-text-image

Ace Your Homework with AI

Get the answers you need in no time with our AI-driven, step-by-step assistance

Get Started

Recommended Textbook for

Pro PowerShell For Database Developers

Authors: Bryan P Cafferky

1st Edition

1484205413, 9781484205419

More Books

Students also viewed these Databases questions

Question

6. Is all Internet training the same? Explain.

Answered: 1 week ago