Use the preceding analysis and any other factors that you think are relevant to make an overall recommendation about whether to proceed with Project Paint Jude. o Your answer might be conditional. Feel free to identify any key questions or concerns that President Dondin needs to address before deciding on the project.
ASAP I HAVE ONLY 15 MINUTES PLEASE
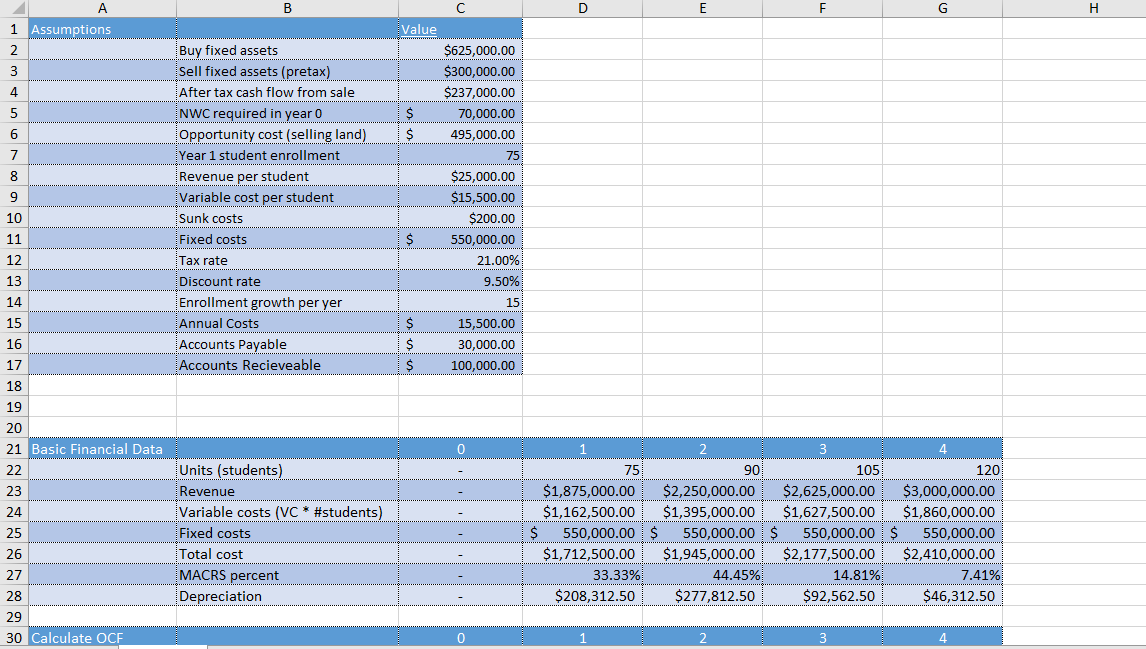
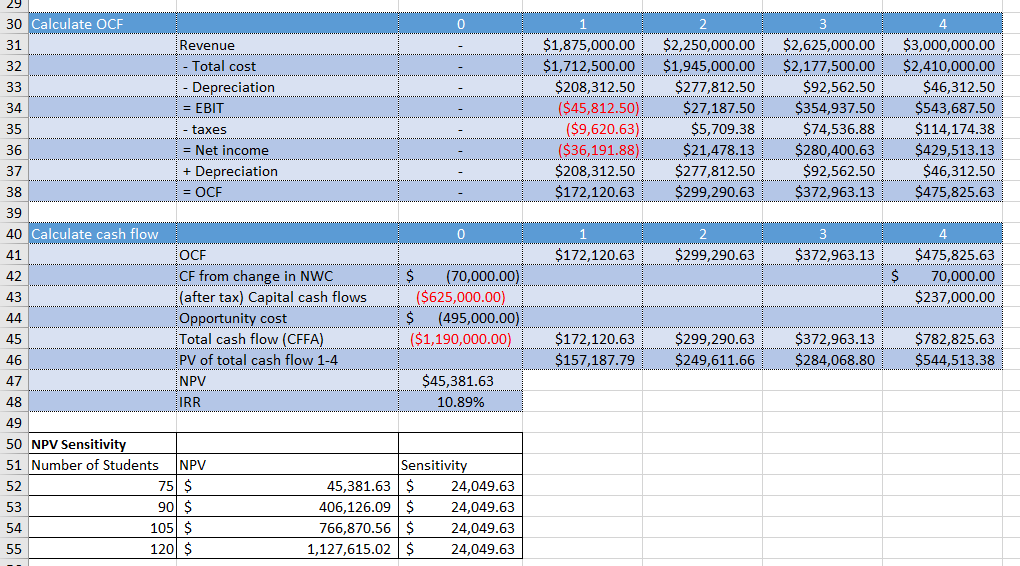
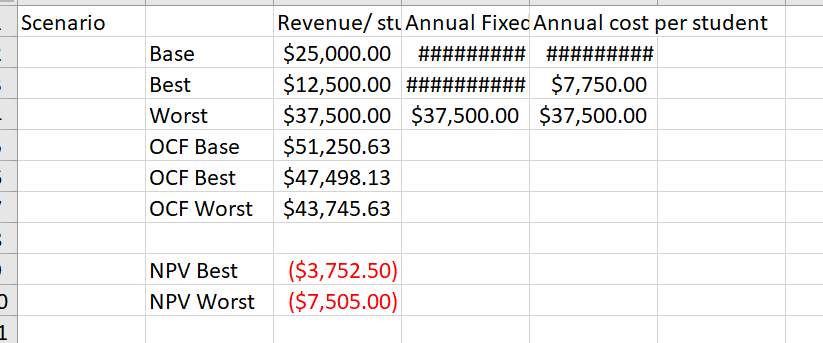
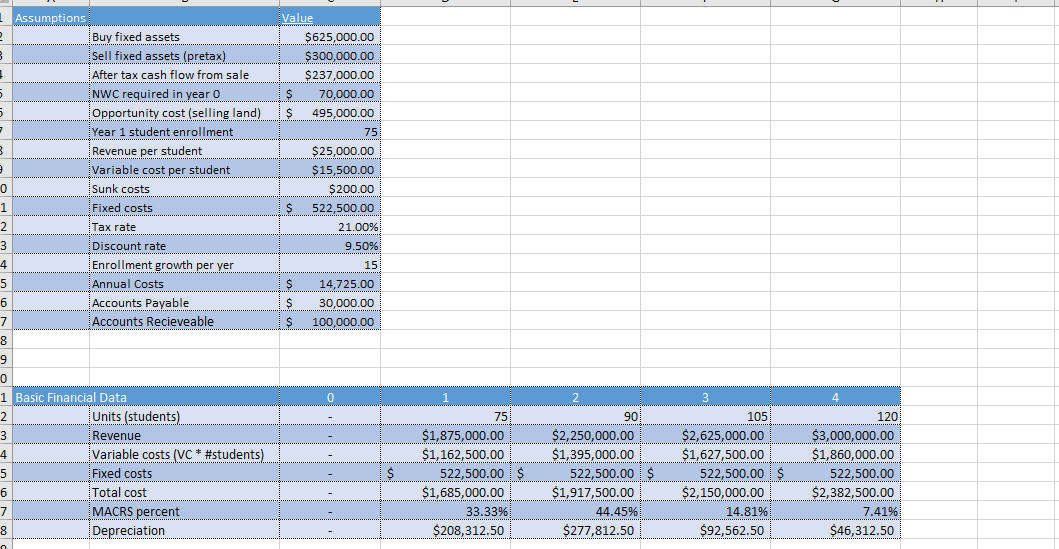
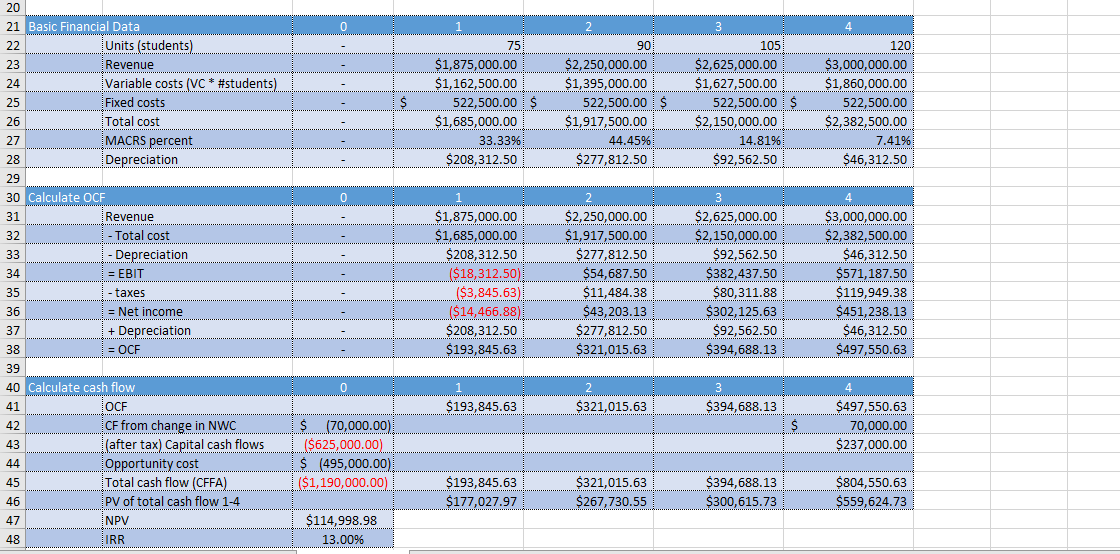
B D E F G H Value 1 Assumptions 2 3 4 5 $ $ 6 7 8 9 Buy fixed assets Sell fixed assets (pretax) After tax cash flow from sale NWC required in year o Opportunity cost (selling land) Year 1 student enrollment Revenue per student Variable cost per student Sunk costs Fixed costs Tax rate Discount rate Enrollment growth per yer Annual Costs Accounts Payable Accounts Recieveable $625,000.00 $300,000.00 $237,000.00 70,000.00 495,000.00 75 $25,000.00 $15,500.00 $200.00 550,000.00 21.00% 9.50% 15 10 11 $ 12 13 14 15 16 17 18 $ $ $ 15,500.00 30,000.00 100,000.00 19 20 21 Basic Financial Data 22 0 23 24 25 Units (students) Revenue Variable costs (VC * #students) Fixed costs Total cost MACRS percent Depreciation 2 75 90 105 120 $1,875,000.00 $2,250,000.00 $2,625,000.00 $3,000,000.00 $1,162,500.00 $1,395,000.00 $1,627,500.00 $1,860,000.00 $ 550,000.00 $ 550,000.00 $ 550,000.00 $ 550,000.00 $1,712,500.00 $1,945,000.00 $2,177,500.00 $2,410,000.00 33.33% 44.45% 14.81% 7.41% $208,312.50 $277,812.50 $92,562.50 $46,312.50 26 27 28 29 30 Calculate OCF 0 29 $1,875,000.00 $1,712,500.00 $208,312.50 ($45,812.50) ($9,620.63) ($36,191.88) $208,312.50 $172,120.63 $2,250,000.00 $1,945,000.00 $277,812.50 $27,187.50 $5,709.38 $21,478.13 $277,812.50 $299,290.63 $2,625,000.00 $2,177,500.00 $92,562.50 $354,937.50 $74,536.88 $280,400.63 $92,562.50 $372,963.13 $3,000,000.00 $2,410,000.00 $46,312.50 $543,687.50 $114,174.38 $429,513.13 $46,312.50 $475,825.63 1 $172,120.63 $299,290.63 $372,963.13 30 Calculate OCF 0 31 Revenue 32 - Total cost 33 Depreciation 34 = EBIT 35 taxes 36 = Net income 37 + Depreciation 38 = OCE 39 40 Calculate cash flow 0 41 OCF 42 CF from change in NWC $ (70,000.00) 43 (after tax) Capital cash flows ($625,000.00) 44 Opportunity cost $ (495,000.00) 45 Total cash flow (CFFA) ($1,190,000.00) 46 PV of total cash flow 1-4 47 NPV $45,381.63 48 IRR 10.89% 49 50 NPV Sensitivity 51 Number of Students NPV Sensitivity 52 750 $ 45,381.63 $ 24,049.63 53 90 $ 406,126.09 $ 24,049.63 54 105 $ 766,870.56 $ 24,049.63 55 120 $ 1,127,615.02 $ 24,049.63 4 $475,825.63 70,000.00 $237,000.00 $ $172,120.63 $157,187.79 $299,290.63 $249,611.66 $372,963.13 $284,068.80 $782,825.63 $544,513.38 Scenario Base Best Worst OCF Base OCF Best OCF Worst Revenue/ stu Annual Fixec Annual cost per student $25,000.00 ### ######### $12,500.00 ########## $ $7,750.00 $37,500.00 $37,500.00 $37,500.00 $51,250.63 $47,498.13 $43,745.63 - - - . NPV Best NPV Worst ($3,752.50) ($7,505.00) 1 Value $625,000.00 $300,000.00 $ 237,000.00 $ 70,000.00 $ 495,000.00 751 $25,000.00 $15,500.00 | Assumptions 2 Buy fixed assets 3 3 Sell fixed assets (pretax) . After tax cash flow from sale 5 5 NWC required in year 0 5 Opportunity cost (selling land) - Year 1 student enrollment B 3 Revenue per student e Variable cost per student 0 Sunk costs 1 1 Fixed costs 2 2 Tax rate 3 Discount rate 4 Enrollment growth per yer 5 Annual Costs 6 Accounts Payable 7 7 Accounts Recieveable 8 $ $200.00 522.500.00 21.00% 9.50% $ S 15 14,725.00 30,000.00 100,000.00 $ 9 0 1 3 4 0 1 Basic Financial Data 2 Units (students) 3 Revenue 4 Variable costs (VC * #students). 5 Fixed costs 6 Total cost 7 MACRS percent 8 Depreciation 75 $1,875,000.00 $1,162,500.00 522,500.00 IS $1,685,000.00 33.33% $208,312.50 2 90 $2,250,000.00 $1,395,000.00 522,500.00 IS $1,917,500.00 44.45% $277,812.50 $ 105 $2,625,000.00 $1,627,500.00 522,500.00 $ $2,150,000.00 14.81% $92,562.50 120 $3,000,000.00 $1,860,000.00 522,500.00 $2,382,500.00 7.41% $46,312.50 0 1 2 4 - - 75 $1,875,000.00 $1,162,500.00 522,500.00 $ $1,685,000.00 33.33% $208,312.50 $ 3 105 $2,625,000.00 $1,627,500.00 522,500.00 $ $2,150,000.00 14.81% $92,562.50 90 $2,250,000.00 $1,395,000.00 522,500.00 $ $1,917,500.00 44.45% $277,812.50 120 $3,000,000.00 $1,860,000.00 522,500.00 $2,382,500.00 7.41% $46,312.50 - 0 1 - 20 21 Basic Financial Data 22 Units (students) 23 Revenue 24 Variable costs (VC * #students) 25 Fixed costs 26 Total cost 27 MACRS percent 28 Depreciation 29 30 Calculate OCF 31 Revenue 32 - Total cost 33 - Depreciation 34 = EBIT 35 - taxes 36 = Net income 37 + Depreciation 38 = OCF 39 40 Calculate cash flow 41 OCF 42 CF from change in NWC 43 (after tax) Capital cash flows 44 Opportunity cost 45 Total cash flow (CFFA) 46 PV of total cash flow 1-4 47 NPV $1,875,000.00 $1,685,000.00 $208,312.50 ($18,312.50) ($3,845.63) ($14,466.88) $208,312.50 $193,845.63 2 $2,250,000.00 $1,917,500.00 $277,812.50 $54,687.50 $11,484.38 $43,203.13 $277,812.50 $321,015.63 3 $2,625,000.00 $2,150,000.00 $92,562.50 $382,437.50 $80,311.88 $302,125.63 $92,562.50 $394,688.13 4 $3,000,000.00 $2,382,500.00 $46,312.50 $571,187.50 $119,949.38 $451,238.13 $46,312.50 $497,550.63 - - 0 1 $193,845.63 2 2 $321,015.63 3 $394,688.13 4 $497,550.63 70,000.00 $237,000.00 $ S(70,000.00) ($625,000.00) $ (495,000.00) ($1,190,000.00) $193,845.63 $177,027.97 $321,015.63 $267,730.55 $394,688.13 $300,615.73 $804,550.63 $559,624.73 $114,998.98 13.00% 48 IRR B D E F G H Value 1 Assumptions 2 3 4 5 $ $ 6 7 8 9 Buy fixed assets Sell fixed assets (pretax) After tax cash flow from sale NWC required in year o Opportunity cost (selling land) Year 1 student enrollment Revenue per student Variable cost per student Sunk costs Fixed costs Tax rate Discount rate Enrollment growth per yer Annual Costs Accounts Payable Accounts Recieveable $625,000.00 $300,000.00 $237,000.00 70,000.00 495,000.00 75 $25,000.00 $15,500.00 $200.00 550,000.00 21.00% 9.50% 15 10 11 $ 12 13 14 15 16 17 18 $ $ $ 15,500.00 30,000.00 100,000.00 19 20 21 Basic Financial Data 22 0 23 24 25 Units (students) Revenue Variable costs (VC * #students) Fixed costs Total cost MACRS percent Depreciation 2 75 90 105 120 $1,875,000.00 $2,250,000.00 $2,625,000.00 $3,000,000.00 $1,162,500.00 $1,395,000.00 $1,627,500.00 $1,860,000.00 $ 550,000.00 $ 550,000.00 $ 550,000.00 $ 550,000.00 $1,712,500.00 $1,945,000.00 $2,177,500.00 $2,410,000.00 33.33% 44.45% 14.81% 7.41% $208,312.50 $277,812.50 $92,562.50 $46,312.50 26 27 28 29 30 Calculate OCF 0 29 $1,875,000.00 $1,712,500.00 $208,312.50 ($45,812.50) ($9,620.63) ($36,191.88) $208,312.50 $172,120.63 $2,250,000.00 $1,945,000.00 $277,812.50 $27,187.50 $5,709.38 $21,478.13 $277,812.50 $299,290.63 $2,625,000.00 $2,177,500.00 $92,562.50 $354,937.50 $74,536.88 $280,400.63 $92,562.50 $372,963.13 $3,000,000.00 $2,410,000.00 $46,312.50 $543,687.50 $114,174.38 $429,513.13 $46,312.50 $475,825.63 1 $172,120.63 $299,290.63 $372,963.13 30 Calculate OCF 0 31 Revenue 32 - Total cost 33 Depreciation 34 = EBIT 35 taxes 36 = Net income 37 + Depreciation 38 = OCE 39 40 Calculate cash flow 0 41 OCF 42 CF from change in NWC $ (70,000.00) 43 (after tax) Capital cash flows ($625,000.00) 44 Opportunity cost $ (495,000.00) 45 Total cash flow (CFFA) ($1,190,000.00) 46 PV of total cash flow 1-4 47 NPV $45,381.63 48 IRR 10.89% 49 50 NPV Sensitivity 51 Number of Students NPV Sensitivity 52 750 $ 45,381.63 $ 24,049.63 53 90 $ 406,126.09 $ 24,049.63 54 105 $ 766,870.56 $ 24,049.63 55 120 $ 1,127,615.02 $ 24,049.63 4 $475,825.63 70,000.00 $237,000.00 $ $172,120.63 $157,187.79 $299,290.63 $249,611.66 $372,963.13 $284,068.80 $782,825.63 $544,513.38 Scenario Base Best Worst OCF Base OCF Best OCF Worst Revenue/ stu Annual Fixec Annual cost per student $25,000.00 ### ######### $12,500.00 ########## $ $7,750.00 $37,500.00 $37,500.00 $37,500.00 $51,250.63 $47,498.13 $43,745.63 - - - . NPV Best NPV Worst ($3,752.50) ($7,505.00) 1 Value $625,000.00 $300,000.00 $ 237,000.00 $ 70,000.00 $ 495,000.00 751 $25,000.00 $15,500.00 | Assumptions 2 Buy fixed assets 3 3 Sell fixed assets (pretax) . After tax cash flow from sale 5 5 NWC required in year 0 5 Opportunity cost (selling land) - Year 1 student enrollment B 3 Revenue per student e Variable cost per student 0 Sunk costs 1 1 Fixed costs 2 2 Tax rate 3 Discount rate 4 Enrollment growth per yer 5 Annual Costs 6 Accounts Payable 7 7 Accounts Recieveable 8 $ $200.00 522.500.00 21.00% 9.50% $ S 15 14,725.00 30,000.00 100,000.00 $ 9 0 1 3 4 0 1 Basic Financial Data 2 Units (students) 3 Revenue 4 Variable costs (VC * #students). 5 Fixed costs 6 Total cost 7 MACRS percent 8 Depreciation 75 $1,875,000.00 $1,162,500.00 522,500.00 IS $1,685,000.00 33.33% $208,312.50 2 90 $2,250,000.00 $1,395,000.00 522,500.00 IS $1,917,500.00 44.45% $277,812.50 $ 105 $2,625,000.00 $1,627,500.00 522,500.00 $ $2,150,000.00 14.81% $92,562.50 120 $3,000,000.00 $1,860,000.00 522,500.00 $2,382,500.00 7.41% $46,312.50 0 1 2 4 - - 75 $1,875,000.00 $1,162,500.00 522,500.00 $ $1,685,000.00 33.33% $208,312.50 $ 3 105 $2,625,000.00 $1,627,500.00 522,500.00 $ $2,150,000.00 14.81% $92,562.50 90 $2,250,000.00 $1,395,000.00 522,500.00 $ $1,917,500.00 44.45% $277,812.50 120 $3,000,000.00 $1,860,000.00 522,500.00 $2,382,500.00 7.41% $46,312.50 - 0 1 - 20 21 Basic Financial Data 22 Units (students) 23 Revenue 24 Variable costs (VC * #students) 25 Fixed costs 26 Total cost 27 MACRS percent 28 Depreciation 29 30 Calculate OCF 31 Revenue 32 - Total cost 33 - Depreciation 34 = EBIT 35 - taxes 36 = Net income 37 + Depreciation 38 = OCF 39 40 Calculate cash flow 41 OCF 42 CF from change in NWC 43 (after tax) Capital cash flows 44 Opportunity cost 45 Total cash flow (CFFA) 46 PV of total cash flow 1-4 47 NPV $1,875,000.00 $1,685,000.00 $208,312.50 ($18,312.50) ($3,845.63) ($14,466.88) $208,312.50 $193,845.63 2 $2,250,000.00 $1,917,500.00 $277,812.50 $54,687.50 $11,484.38 $43,203.13 $277,812.50 $321,015.63 3 $2,625,000.00 $2,150,000.00 $92,562.50 $382,437.50 $80,311.88 $302,125.63 $92,562.50 $394,688.13 4 $3,000,000.00 $2,382,500.00 $46,312.50 $571,187.50 $119,949.38 $451,238.13 $46,312.50 $497,550.63 - - 0 1 $193,845.63 2 2 $321,015.63 3 $394,688.13 4 $497,550.63 70,000.00 $237,000.00 $ S(70,000.00) ($625,000.00) $ (495,000.00) ($1,190,000.00) $193,845.63 $177,027.97 $321,015.63 $267,730.55 $394,688.13 $300,615.73 $804,550.63 $559,624.73 $114,998.98 13.00% 48 IRR