Question
Use the prepared template to develop a revised cash budget for MTI for the 2001-2002 fiscal year. Note that the spreadsheet model incorporates Billy Youngs
Use the prepared template to develop a revised cash budget for MTI for the 2001-2002 fiscal year. Note that the spreadsheet model incorporates Billy Youngs assumptions that (1) the entire impact of the $199,000 reduction in revenues in Exhibit 6 occurs in September, and (2) that the salary increase and new hire are off the table until fiscal year 2002. If you make changes in staffing, be prepared to justify your decisions, given the potential impact of layoffs on MTIs ability to respond when business recovers. You may use the template to: Manipulate post 9/11 revenues using best case, worst case and middle ground scenarios. Eliminate or reinstate the incentives for salaried employees. Defer some proportion of fixed salaries; any deferred compensation will appear as a liability on MTIs 8/31/2002 balance sheet. Defer some portion of the rent on the Seattle office; any deferred rent will appear as a liability on MTIs 8/31/2002 balance sheet. Lay off up to eight salaried employees. Decisions about retaining or eliminating the new hire at $35,000 per year are controlled entirely by the macros. The original revenue and reinstate incentives scenarios retain the new hire. All other scenarios assume the new hire is eliminated. Be sure to follow the instructions in the supplemental excel files when completed the work for requirement 4. You should provide a detailed discussion regarding why you made the choices that you did, it is not enough to simply submit the excel file.
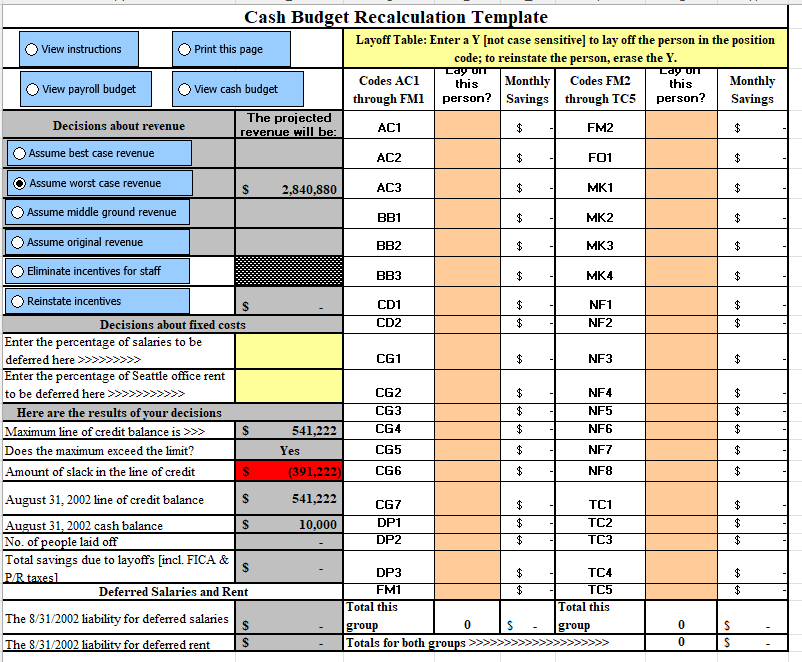
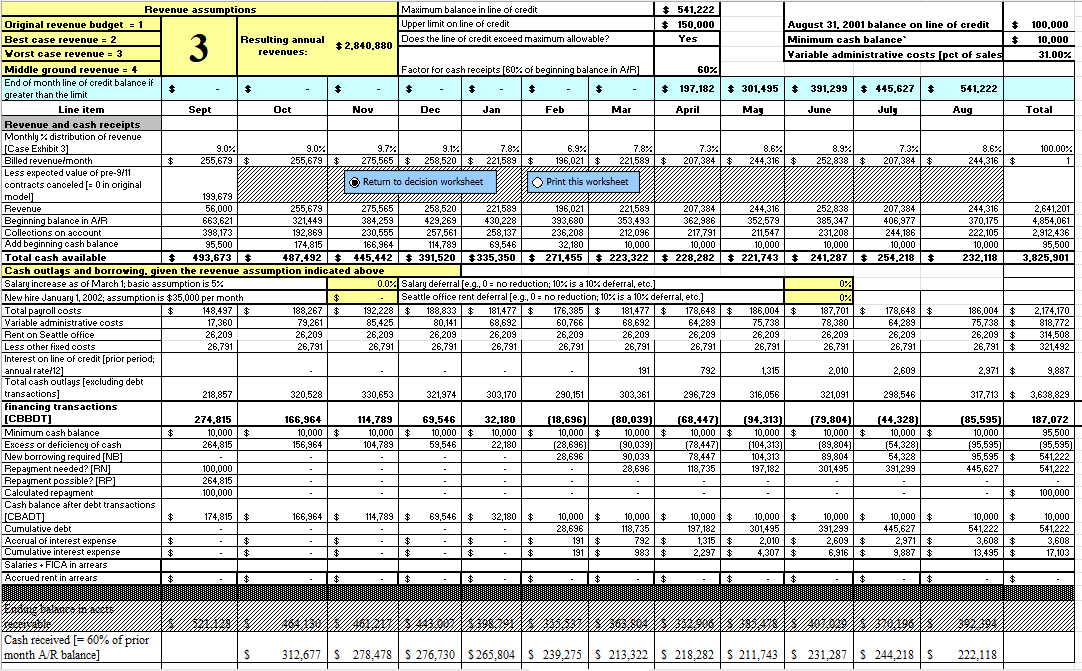
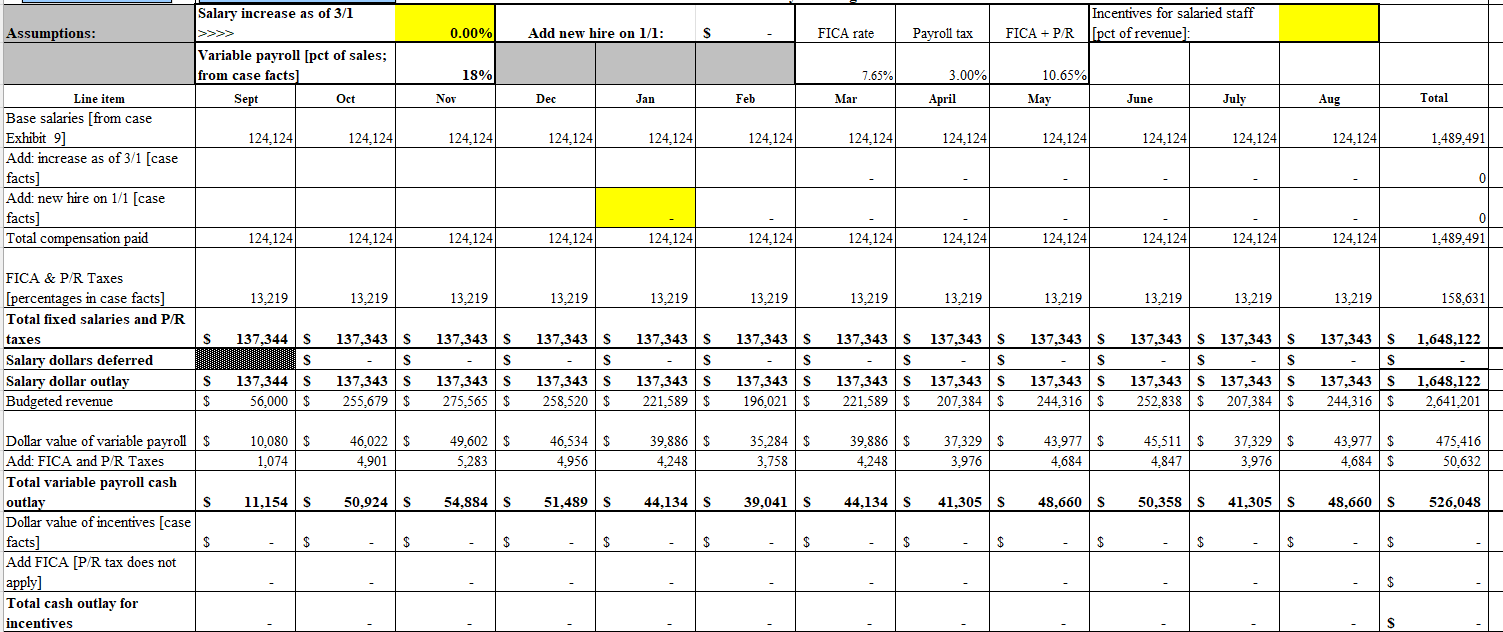
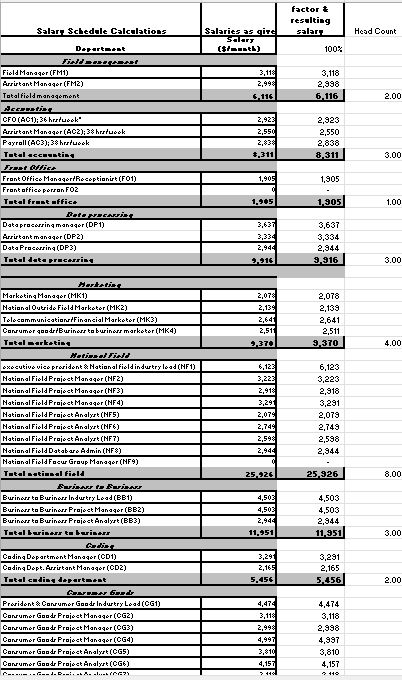
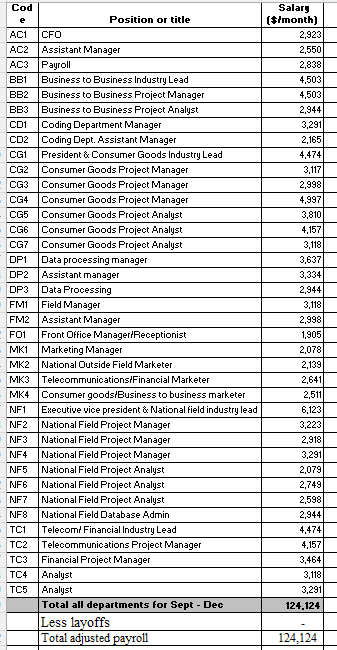
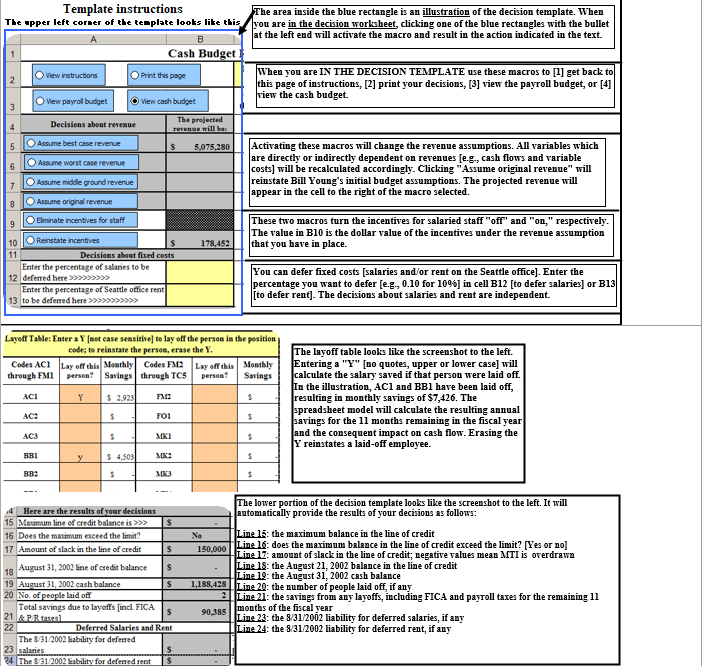 \begin{tabular}{|c|c|c|c|c|c|c|c|c|c|} \hline \multicolumn{10}{|c|}{ Cash Budget Recalculation Template } \\ \hline View instructions & \multicolumn{3}{|c|}{\begin{tabular}{|l|l|} Print this page \\ \end{tabular}} & \multicolumn{6}{|c|}{\begin{tabular}{l} Layoff Table: Enter a Y [not case sensitive] to lay off the person in the position \\ code; to reinstate the person, erase the Y. \end{tabular}} \\ \hline View payroll budget & \multicolumn{3}{|c|}{ View cash budget } & \begin{tabular}{c} Codes ACl \\ through FMl \end{tabular} & \begin{tabular}{l} Layorr \\ this \\ person? \end{tabular} & \begin{tabular}{l} Monthly \\ Savings \end{tabular} & \begin{tabular}{c} Codes FM2 \\ through TC5 \end{tabular} & \begin{tabular}{l} Layor \\ this \\ person? \end{tabular} & \begin{tabular}{l} Monthly \\ Savings \end{tabular} \\ \hline \multicolumn{2}{|c|}{ Decisions about revenue } & \multicolumn{2}{|c|}{\begin{tabular}{l} The projected \\ revenue will be: \end{tabular}} & AC1 & & $ & FM2 & & $ \\ \hline \multicolumn{2}{|l|}{ Assume best case revenue } & & & AC2 & & $ & FO1 & & $ \\ \hline \multicolumn{2}{|c|}{ O Assume worst case revenue } & & 2,840,880 & AC3 & & $ & MK1 & & $ \\ \hline \multicolumn{2}{|c|}{ Assume middle ground revenue } & & & BB1 & & $ & MK2 & & $ \\ \hline \multicolumn{2}{|l|}{ Assume original revenue } & & & BB2 & & $ & MK3 & & $ \\ \hline \multicolumn{2}{|c|}{ Oliminate incentives for staff } & & & BB3 & & $ & MK4 & & $ \\ \hline Reinstate incentives & & $ & & CD1 & & $ & NF1 & & $ \\ \hline \multicolumn{4}{|c|}{ Decisions about fixed costs } & CD2 & & $ & NF2 & & $ \\ \hline & & & CG1 & & $ & NF3 & & $ \\ \hline & & & CG2 & & $ & NF4 & & $ \\ \hline \multicolumn{4}{|c|}{ Here are the results of your decisions } & CG3 & & $ & NF5 & & $ \\ \hline \multicolumn{2}{|c|}{ Maximum line of credit balance is } & $ & 541,222 & CG4 & & $ & NF6 & & $ \\ \hline \multicolumn{2}{|c|}{ Does the maximum exceed the limit? } & & les & CG5 & & $ & NF7 & & $ \\ \hline \multicolumn{2}{|c|}{ Amount of slack in the line of credit } & s & (391,222) & CG6 & & $ & NF8 & & $ \\ \hline \multicolumn{2}{|c|}{ August 31,2002 line of credit balance } & & 541,222 & CG7 & & $ & TC1 & & $ \\ \hline \multicolumn{2}{|c|}{ August 31,2002 cash balance } & $ & 10,000 & DP1 & & $ & TC2 & & $ \\ \hline \multicolumn{2}{|l|}{ No. of people laid off } & & - & DP2 & & $ & TC3 & & $ \\ \hline \multicolumn{2}{|c|}{\begin{tabular}{l} Total savings due to layoffs [incl. FICA \& \\ P/R taxes] \end{tabular}} & $ & - & DP3 & & $ & TC4 & & $ \\ \hline \multicolumn{4}{|c|}{ Deferred Salaries and Rent } & FM1 & & $ & TC5 & & $ \\ \hline \multicolumn{2}{|c|}{ The 8/31/2002 liability for deferred salaries } & $ & - & \begin{tabular}{l} Total this \\ group \end{tabular} & 0 & s - & \begin{tabular}{l} Total this \\ group \end{tabular} & 0 & s \\ \hline \multicolumn{2}{|c|}{ The 8/31/2002 liability for deferred rent } & $ & - & \multicolumn{4}{|c|}{ Totals for both groups } & 0 & s \\ \hline \end{tabular} \begin{tabular}{|c|c|c|c|c|c|c|c|c|c|c|c|c|c|} \hline \multirow{2}{*}{ Assumptions: } & \multicolumn{3}{|c|}{ Salary increase as of 3/1} & \multicolumn{2}{|c|}{ Add new hire on 1/1: } & s & FICA rate & Payroll tax & FICA+P/R & \multicolumn{2}{|c|}{\begin{tabular}{l} Incentives for salaried staff \\ [pct of revenue]: \end{tabular}} & & \\ \hline & \begin{tabular}{l} Variable payroll \\ from case facts \end{tabular} & 1 [pct of sales; & 18% & & & & 7.65% & 3.00% & 10.65% & & & & \\ \hline Line item & Sept & Oct & Nor & Dec & Jan & Feb & Mar & April & May & June & July & Aug & Total \\ \hline \begin{tabular}{l} Base salaries [from case \\ Exhibit 9] \end{tabular} & 124,124 & 124,124 & 124,124 & 124,124 & 124,124 & 124,124 & 124,124 & 124,124 & 124,124 & 124,124 & 124,124 & 124,124 & 1,489,49 \\ \hline \begin{tabular}{l} Add: increase as of 3/1 [case \\ facts] \end{tabular} & & & & & & & - & - & - & . & - & - & \\ \hline \begin{tabular}{l} Add: new hire on 1/1 [case \\ facts] \end{tabular} & & & & & - & - & - & - & - & - & - & - & \\ \hline Total compensation paid & 124,124 & 124,124 & 124,124 & 124,124 & 124,124 & 124,124 & 124,124 & 124,124 & 124,124 & 124,124 & 124,124 & 124,124 & 1,489,49 \\ \hline \begin{tabular}{l} FICA \& P/R Taxes \\ [percentages in case facts] \end{tabular} & 13,219 & 13,219 & 13,219 & 13,219 & 13,219 & 13,219 & 13,219 & 13,219 & 13,219 & 13,219 & 13,219 & 13,219 & 158,63 \\ \hline \begin{tabular}{l} Total fixed salaries and P/R \\ taxes \end{tabular} & s 137,344 & 137,343 & 137,343 & 137,343 & 137,343 & 137,343 & 137,343 & S 137,343 & 137,343 & 137,343 & s 137,343 & s 137,343 & S 1,648,122 \\ \hline \begin{tabular}{l} Salary dollars deferred \\ \end{tabular} & & s & s & s & s & s & - & s & s & s & s & s & - \\ \hline Salary dollar outlay & \begin{tabular}{|l|l|} S & 137,344 \\ \end{tabular} & 137,343 & 137,343 & 137,343 & 137,343 & 137,343 & 137,343 & \begin{tabular}{|ll|} S & 137,343 \\ \end{tabular} & \begin{tabular}{|l|l|} s & 137,343 \\ \end{tabular} & 137,343 & \begin{tabular}{|ll|} S & 137,343 \\ \end{tabular} & 137,343 & \begin{tabular}{|l|l|} s & 1,648,122 \\ \end{tabular} \\ \hline Budgeted revenue & 56,000 & 255,679 & 275,565 & 258,520 & 221,589 & 196,021 & 221,589 & $207,384 & 244,316 & 252,838 & $207,384 & 244,316 & 2,641,201 \\ \hline Dollar value of variable payroll & 10,080 & 46,022 & 49,602 & 46,534 & 39,886 & 35,284 & 39,886 & 37,329 & 43,977 & 45,511 & 37,329 & 43,977 & 475,416 \\ \hline Add: FICA and P/R Taxes & 1,074 & 4,901 & 5,283 & 4,956 & 4,248 & 3,758 & 4,248 & 3,976 & 4,684 & 4,847 & 3,976 & 4,684 & 50,632 \\ \hline \begin{tabular}{l} Total variable payroll cash \\ outlay \end{tabular} & 11,154 & 50,924 & 54,884 & 51,489 & 44,134 & 39,041 & 44,134 & 41,305 & 48,660 & 50,358 & S 41,305 & 48,660 & 526,048 \\ \hline \begin{tabular}{l} Dollar value of incentives [case \\ facts] \end{tabular} & $ & $ & $ & $ & $ & $ & $ & $ & $ & $ & $ & $ & $ \\ \hline \begin{tabular}{l} Add FICA [P/R tax does not \\ apply] \end{tabular} & - & - & - & - & - & - & - & - & - & - & - & - & $ \\ \hline \begin{tabular}{l} Total cash outlay for \\ incentives \end{tabular} & & & & & & & & & & & & - & s \\ \hline \end{tabular} \begin{tabular}{|c|c|c|c|} \hline Salarr Schedale Calculations & Salaries as gire & \begin{tabular}{c} factor t \\ resulting \\ salark \end{tabular} & Head Count \\ \hline Doperte+et & \begin{tabular}{l} Sams \\ (\$tankt) \end{tabular} & 100% & \\ \hline \\ \hline FieldMandqer (FM11) & 3,113 & 3,118 & \\ \hline Furirtant Manaqer (FM2) & 2,498 & 2,998 & \\ \hline Tatalfield manaqument & 6.116 & 6.116 & 2.00 \\ \hline \\ \hline CFO(AO1); 36 hrstuoek" & 2,423 & 2,923 & \\ \hline Arrirtant Manaqer (AC2); 3s hrrtuesk & 2,550 & 2,550 & \\ \hline Fayrall(AC3); 3& hrrituesk & 2,838 & 2,838 & \\ \hline Intel ecenenties & =,311 & 8,311 & 3.00 \\ \hline \multicolumn{4}{|l|}{ Fret abies } \\ \hline Frant Offise Manaqerifieseptianirk (Fo1) & 1,905 & 1,905 & \\ \hline Frant affies perran FO2 & 0 & - & \\ \hline Intel frote affict & 1,945 & 1.905 & 1.00 \\ \hline \multicolumn{4}{|l|}{ Boterecarit: } \\ \hline Datapracarring manaqur (DF1) & 3,637 & 3,637 & \\ \hline Aursirtant manaqur (DF2) & 3,334 & 3,334 & \\ \hline DakaFracarsing(DF3) & 2,444 & 2,944 & \\ \hline Intel det=proctrrie, & & 9.916 & 3.00 \\ \hline \multicolumn{4}{|l|}{ Nortaties. } \\ \hline MarketinManaquer (MK1) & 2,07 & 2,078 & \\ \hline Matianal Outride FieldMarketer (MKZ) & 2,13 & 2,139 & \\ \hline TelesammunieatianrfFinansial Marketer (MK3) & 2,64 & 2,641 & \\ \hline Cansumer quadri'Burinars ta burinass marketer (MKA) & 2,511 & 2,511 & \\ \hline Int=1 =urktties & 2.3701 & 9.370 & 4.00 \\ \hline \multicolumn{4}{|l|}{ Motinewriell } \\ \hline & 6,123 & 6,123 & \\ \hline NatianalFieldFraiest Manaqur (WF2) & 3,223 & 3,223 & \\ \hline NatianalFieldFrajest Manaqer (NF3) & 2,413 & 2,918 & \\ \hline NatianalFieldFrajest Manaqur (WFa) & 3,291 & 3,291 & \\ \hline Natianal FieldFrajest Analyst(WF5) & 2,073 & 2,079 & \\ \hline HatianalFieldFrajest Analyst (WF6) & 2,744 & 2,749 & \\ \hline Natianal Field Frajest Analyst(WF7) & 2,548 & 2,598 & \\ \hline Hatianal FieldDakabaro Admin (MFs) & 2,944 & 2,944 & \\ \hline Hatianal Fieldf acur Graup Manaqer (WF9) & & - & \\ \hline Intell s-kintel fiold & 25,226 & 25.926 & 8.00 \\ \hline \multicolumn{4}{|l|}{ Seritary to suritary } \\ \hline Burinars ta Burinasr Indurkry Losd (BE1) & 4,503 & 4,503 & \\ \hline Burinass ta Burinass Prajest Manaqur (EB2) & 4,503 & 4,503 & \\ \hline Burinass ta Eurinass Frajest Analyst (BE3) & 2,944 & 2,944 & \\ \hline Intel beriens to buriess & 11,951 & 11.951 & 3.00 \\ \hline \multicolumn{4}{|l|}{ B-die: } \\ \hline CadinaDepartmentManaqer (CD1) & 3,29 & 3,291 & \\ \hline CadinsDept. Arrirkant Mansqer (CD2) & 2,165 & 2,165 & \\ \hline Int=l endies depertatet & 5,456 & 5.456 & 2.00 \\ \hline \\ \hline Frorident \& Canrumer Gaadr Indurtry Lead(CG1) & 4,474 & 4,474 & \\ \hline Carrumer Gaodr Frajest Manaqer (CG2) & 3,118 & 3,116 & \\ \hline Ganumer Gaadr Frajest Mandqer (CG3) & 2,498 & 2,998 & \\ \hline Carrumer Gaodr Frajest Manaqer (CGd) & 4,940 & 4,997 & \\ \hline Carumer Gads Frajest Analysk (CG5) & 3,810 & 3,810 & \\ \hline Canumer Gade Fraject Analyst (CG6) & 4,15 & 4,157 & \\ \hline & 3+14 & =148 & \\ \hline \end{tabular} \begin{tabular}{|c|c|c|} \hline \begin{tabular}{c} Cod \\ e \end{tabular} & Position or title & \begin{tabular}{c} Salary \\ [\$Imonth] \end{tabular} \\ \hline AC1 & CFO & 2,923 \\ \hlineAC2 & Assistant Manager & 2,550 \\ \hline & Payroll & 2,838 \\ \hline BB1 & Business to Business Industry Lead & 4,503 \\ \hline BB2 & Business to Business Project Manager & 4,503 \\ \hline BE3 & Business to Business Project Analyst & 2,944 \\ \hline CD1 & Coding Department Manager & 3,291 \\ \hline CD2 & Coding Dept. Assistant Manager & 2,165 \\ \hline CG1 & Fresident \& Consumer Goods Industry Lead & 4,474 \\ \hline CG2 & Consumer Goods Project Manager & 3,117 \\ \hline CG3 & Consumer Goods Project Manager & 2,998 \\ \hline CG4 & Consumer Goods Project Manager & 4,997 \\ \hline CG5 & Consumer Goods Project Analyst & 3,810 \\ \hlineCG6 & Consumer Goods Project Analyst & 4,157 \\ \hline CG7 & Consumer Goods Project Analyst & 3,118 \\ \hline DP1 & Data processing manager & 3,637 \\ \hline DP2 & Assistant manager & 3,334 \\ \hline DP3 & Data Processing & 2,944 \\ \hline FM1 & Field Manager & 3,118 \\ \hline FM2 & Assistant Manager & 2,998 \\ \hline F01 & Front Office Managerl'Receptionist & 1,905 \\ \hline MK1 & Marketing Manager & 2,078 \\ \hline MK2 & National Outside Field Marketer & 2,139 \\ \hline MK3 & TelecommunicationsFinancial Marketer & 2,641 \\ \hline MK4 & Consumer goodstBusiness to business marketer & 2,511 \\ \hline NF1 & Executive vice president \& National field industry lead & 6,123 \\ \hline NF2 & National Field Project Manager & 3,223 \\ \hline NF3 & National Field Project Manager & 2,918 \\ \hline NF4 & National Field Froject Manager & 3,291 \\ \hline NF5 & National Field Project Analyst & 2,079 \\ \hline NF6 & National Field Project Analyst & 2,749 \\ \hline NF7 & National Field Project Analyst & 2,598 \\ \hline NF8 & National Field Database Admin & 2,944 \\ \hline TC1 & Telecomd Financial Industry Lead & 4,474 \\ \hline TC2 & Telecommunications Project Manager & 4,157 \\ \hline TC3 & Financial Project Manager & 3,464 \\ \hline TC4 & Analyst & 3,118 \\ \hline \multirow[t]{4}{*}{ TC5 } & Analyst & 3,291 \\ \hline & Total all departments for Sept - Dec & 124.124 \\ \hline & Less layoffs & - \\ \hline & Total adjusted payroll & 124,124 \\ \hline \end{tabular} the basition : The layoff table lools like the screenshot to the left. Entering a " Y " [no quotes, upper or lower case] will calculate the salary saved if that person were laid off. In the illustration, ACl and BBl have been laid off, resulting in monthly savings of $7,426. The spreadsheet model will calculate the resulting annual savings for the 11 months remaining in the fiscal year and the consequent impact on cash flow. Erasing the Y reinstates a laid-off employee. The lower portion of the decision template looks like the screenshot to the left. It will automatically provide the results of your decisions as follows: Line 15: the maximum balance in the line of credit Line 16: does the maximum balance in the line of credit exceed the limit? [Yes or no] Line 17: amount of slack in the line of credit; negative values mean MTI is overdrawn Line 18: the August 21, 2002 balance in the line of credit Line 19: the August 31, 2002 cash balance Line 20: the number of people laid off, if any Line 21: the savings from any layoffs, including FICA and payroll taxes for the remaining 11 months of the fiscal year Line 23: the 8/31/2002 liability for deferred salaries, if any Line 24: the 8/31/2002 liability for deferred rent, if any
 Step by Step Solution
There are 3 Steps involved in it
Step: 1

Get Instant Access to Expert-Tailored Solutions
See step-by-step solutions with expert insights and AI powered tools for academic success
Step: 2

Step: 3

Ace Your Homework with AI
Get the answers you need in no time with our AI-driven, step-by-step assistance
Get Started


