Use the ratios you calculated for 2017 and the 2016 ratios given above to compare and answer the following question.
Which year did Comfy Home have the highest accounts receivable turnover? 2016 or 2017?
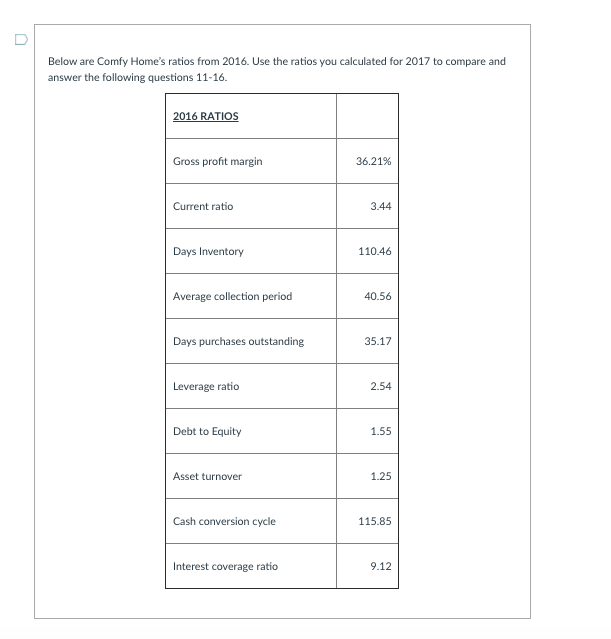
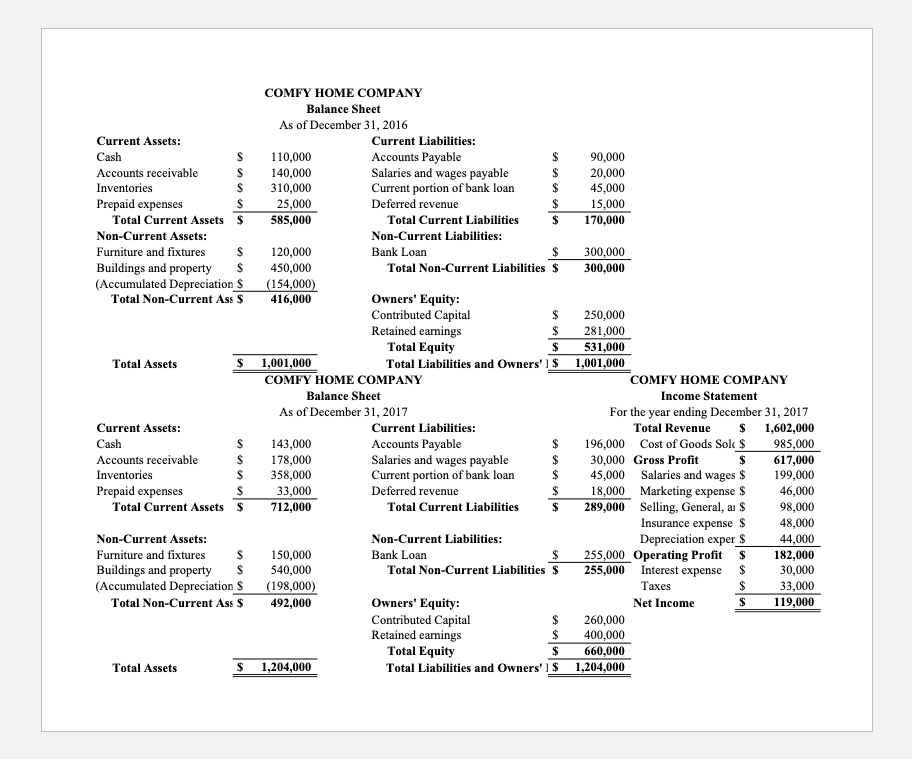
U Below are Comfy Home's ratios from 2016. Use the ratios you calculated for 2017 to compare and answer the following questions 11-16. 2016 RATIOS Gross profit margin 36.21% Current ratio 3.44 Days Inventory 110.46 Average collection period 40.56 Days purchases outstanding 35.17 Leverage ratio 2.54 Debt to Equity 1.55 Asset turnover 1.25 Cash conversion cycle 115.85 Interest coverage ratio 9.12 COMFY HOME COMPANY Balance Sheet As of December 31, 2016 Current Assets: Current Liabilities: Cash S 110,000 Accounts Payable $ 90,000 Accounts receivable S 140,000 Salaries and wages payable $ 20,000 Inventories S 310,000 Current portion of bank loan $ 45,000 Prepaid expenses S 25,000 Deferred revenue $ 15,000 Total Current Assets $ 585,000 Total Current Liabilities $ 170,000 Non-Current Assets: Non-Current Liabilities: Furniture and fixtures s 120,000 Bank Loan $ 300,000 Buildings and property S 450,000 Total Non-Current Liabilities $ 300,000 (Accumulated Depreciations (154,000) Total Non-Current Ass $ 416,000 Owners' Equity: Contributed Capital $ 250,000 Retained earnings $ 281,000 Total Equity $ 531,000 Total Assets $ 1,001,000 Total Liabilities and Owners'] $ 1,001,000 COMFY HOME COMPANY COMFY HOME COMPANY Balance Sheet Income Statement As of December 31, 2017 For the year ending December 31, 2017 Current Assets: Current Liabilities: Total Revenue $ 1,602,000 Cash S 143,000 Accounts Payable $ 196,000 Cost of Goods Sok $ 985,000 Accounts receivable S 178,000 Salaries and wages payable $ 30,000 Gross Profit $ 617,000 Inventories S 358,000 Current portion of bank loan $ 45,000 Salaries and wages $ 199,000 Prepaid expenses S 33,000 Deferred revenue $ 18,000 Marketing expense $ 46,000 Total Current Assets $ 712,000 Total Current Liabilities $ 289,000 Selling, General, a $ 98,000 Insurance expense $ 48,000 Non-Current Assets: Non-Current Liabilities: Depreciation exper $ 44,000 Furniture and fixtures $ 150,000 Bank Loan $ 255,000 Operating Profit $ 182,000 Buildings and property S 540,000 Total Non-Current Liabilities $ 255,000 Interest expense $ 30,000 (Accumulated Depreciations (198,000) Taxes $ 33,000 Total Non-Current Ass $ 492,000 Owners' Equity: Net Income $ 119,000 Contributed Capital $ 260,000 Retained earnings $ 400,000 Total Equity $ 660,000 Total Assets $ 1,204,000 Total Liabilities and Owners' $ 1,204,000