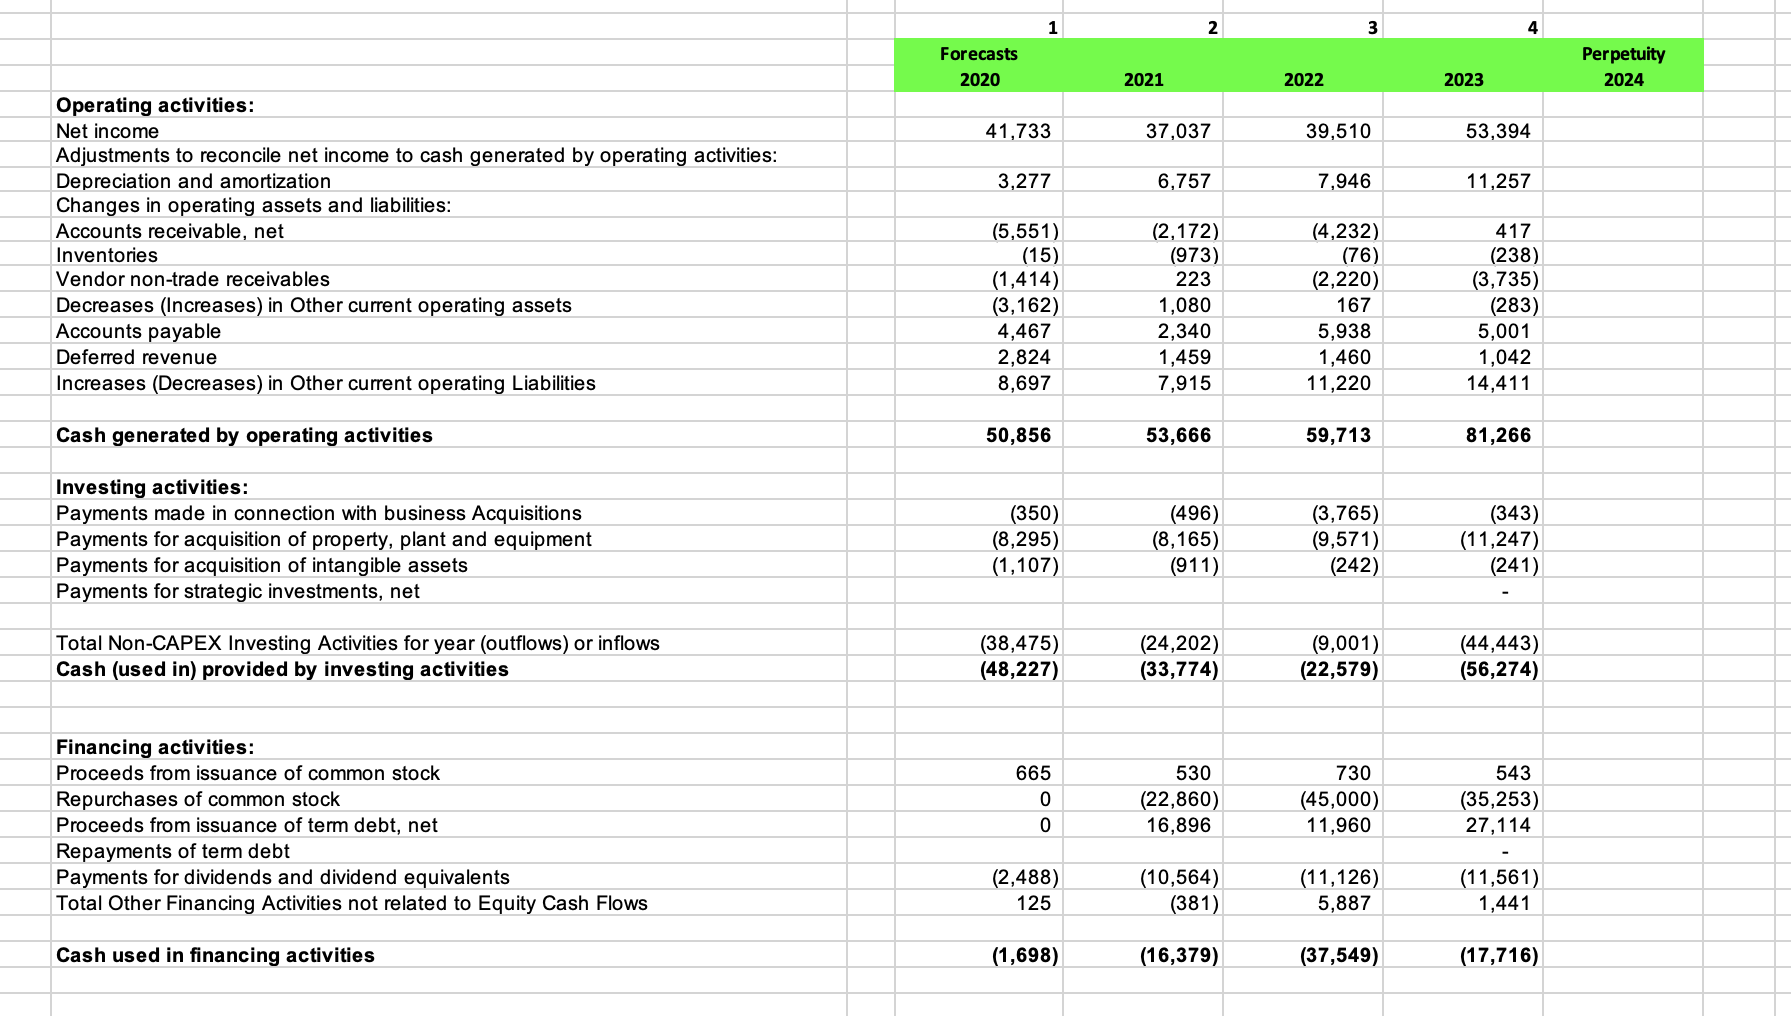
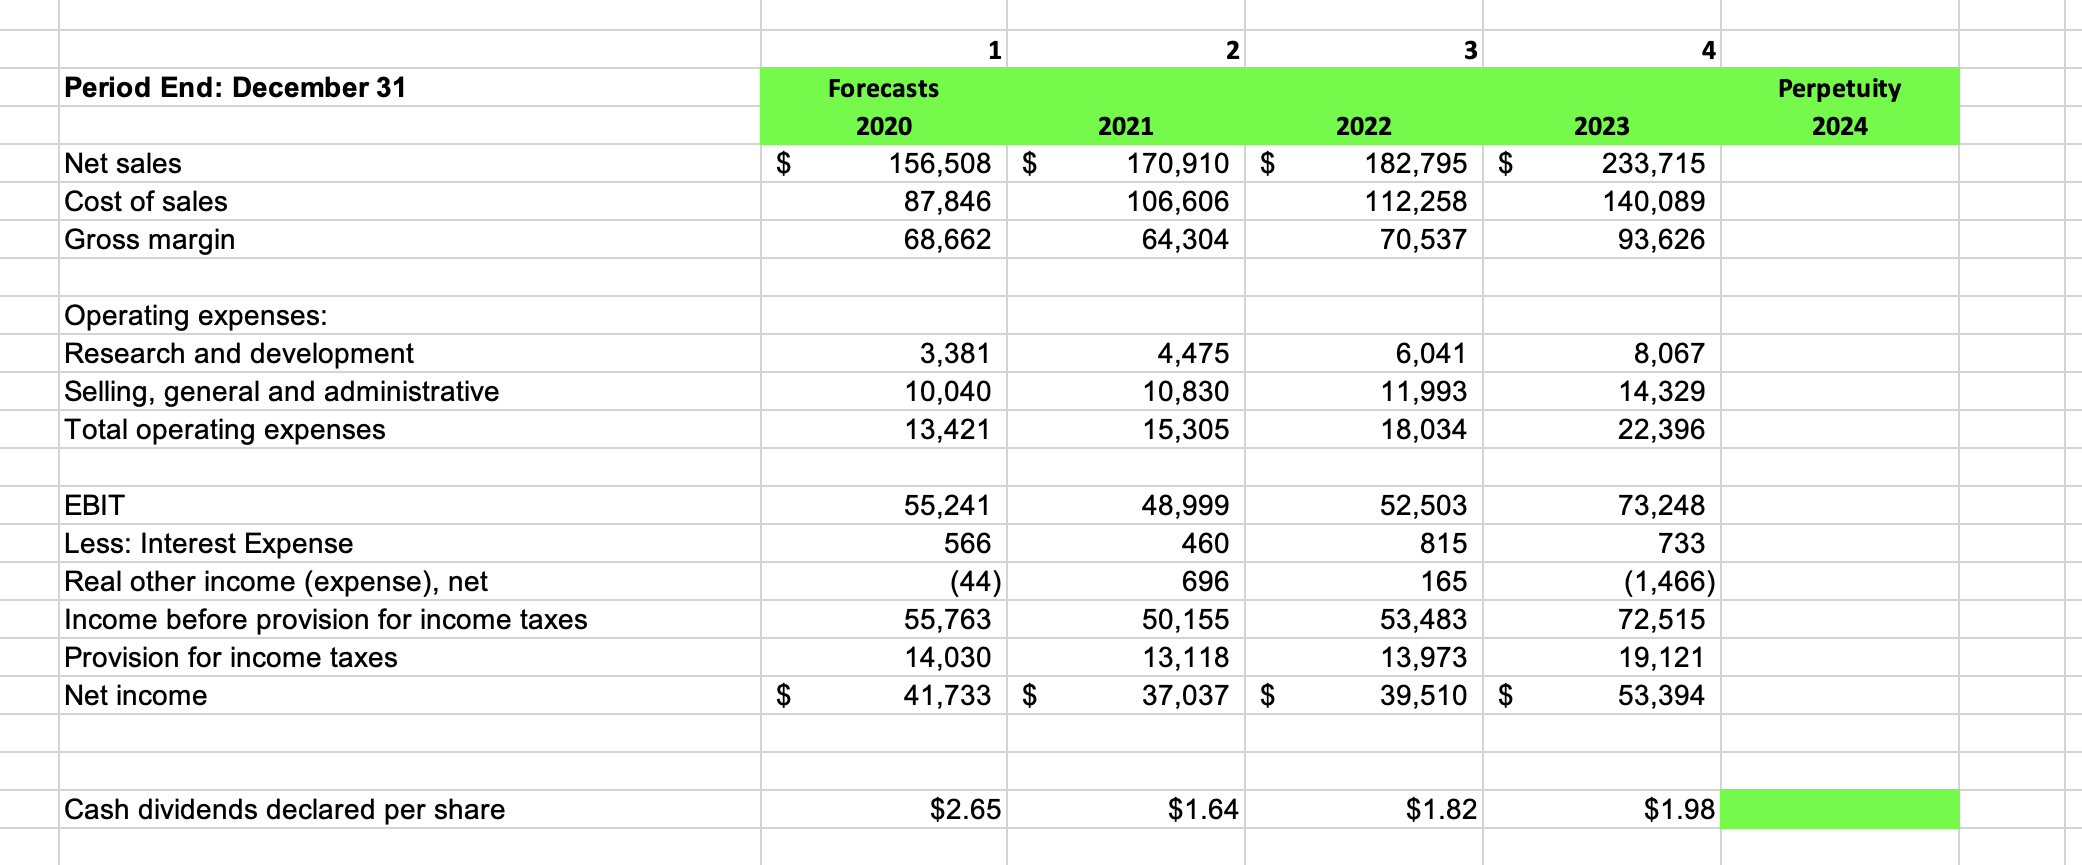
Use the relevant information contained in the Cash Flow and Income Statement Tabs. Value the shares of subject-company as at the end of 2019 using the income approach by discounting the stream of Net Free Cash Flow to Invested Capital Benefits. Round to the nearest whole cent (i.e. $12.9876 would be written as 12.99). State on a per share basis. Use end of period discounting.
Assume the seed value to the perpetuity beginning in 2024 is Free Cash Flow to Invested Capital = 54,840 and that the perpetuity growth rate will be 4.5% annually. Cost of Equity is 10.18% and WACC is 9.65%. Shares outstanding at the valuation date equals 6,557. Assume the market value of interest bearing liabilities is $16,664 at the end of 2019. Assume the appropriate tax rate is 27% for this problem.

1 2 3 4 Forecasts 2020 Perpetuity 2024 2021 2022 2023 41,733 37,037 39,510 53,394 3,277 6,757 7,946 11,257 Operating activities: Net income Adjustments to reconcile net income to cash generated by operating activities: Depreciation and amortization Changes in operating assets and liabilities: Accounts receivable, net Inventories Vendor non-trade receivables Decreases (Increases) in Other current operating assets Accounts payable Deferred revenue Increases (Decreases) in Other current operating Liabilities (5,551) (15) (1,414) (3,162) 4,467 2,824 8,697 (2,172) (973) 223 1,080 2,340 1,459 7,915 (4,232) (76) (2,220) 167 5,938 1,460 11,220 417 (238) (3,735) (283) 5,001 1,042 14,411 Cash generated by operating activities 50,856 53,666 59,713 81,266 Investing activities: Payments made in connection with business Acquisitions Payments for acquisition of property, plant and equipment Payments for acquisition of intangible assets Payments for strategic investments, net (350) (8,295) (1,107) (496) (8,165) (911) (3,765) (9,571) (242) (343) (11,247) (241) Total Non-CAPEX Investing Activities for year (outflows) or inflows Cash (used in) provided by investing activities (38,475) (48,227) (24,202) (33,774) (9,001) (22,579) (44,443) (56,274) 665 0 Financing activities: Proceeds from issuance of common stock Repurchases of common stock Proceeds from issuance of term debt, net Repayments of term debt Payments for dividends and dividend equivalents Total Other Financing Activities not related to Equity Cash Flows 530 (22,860) 16,896 730 (45,000) 11,960 543 (35,253) 27,114 0 (2,488) 125 (10,564) (381) (11,126) 5,887 (11,561) 1,441 Cash used in financing activities (1,698) (16,379) (37,549) (17,716) 1 2 3 Period End: December 31 Perpetuity 2024 $ Net sales Cost of sales Gross margin Forecasts 2020 156,508 $ 87,846 68,662 2021 170,910 $ 106,606 64,304 2022 182,795 $ 112,258 70,537 2023 233,715 140,089 93,626 Operating expenses: Research and development Selling, general and administrative Total operating expenses 3,381 10,040 13,421 4,475 10,830 15,305 6,041 11,993 18,034 8,067 14,329 22,396 EBIT Less: Interest Expense Real other income (expense), net Income before provision for income taxes Provision for income taxes Net income 55,241 566 (44) 55,763 14,030 41,733 $ 48,999 460 696 50,155 13,118 37,037 $ 52,503 815 165 53,483 13,973 39,510 $ 73,248 733 (1,466) 72,515 19,121 53,394 Cash dividends declared per share $2.65 $1.64 $1.82 $1.98 1 2 3 4 Forecasts 2020 Perpetuity 2024 2021 2022 2023 41,733 37,037 39,510 53,394 3,277 6,757 7,946 11,257 Operating activities: Net income Adjustments to reconcile net income to cash generated by operating activities: Depreciation and amortization Changes in operating assets and liabilities: Accounts receivable, net Inventories Vendor non-trade receivables Decreases (Increases) in Other current operating assets Accounts payable Deferred revenue Increases (Decreases) in Other current operating Liabilities (5,551) (15) (1,414) (3,162) 4,467 2,824 8,697 (2,172) (973) 223 1,080 2,340 1,459 7,915 (4,232) (76) (2,220) 167 5,938 1,460 11,220 417 (238) (3,735) (283) 5,001 1,042 14,411 Cash generated by operating activities 50,856 53,666 59,713 81,266 Investing activities: Payments made in connection with business Acquisitions Payments for acquisition of property, plant and equipment Payments for acquisition of intangible assets Payments for strategic investments, net (350) (8,295) (1,107) (496) (8,165) (911) (3,765) (9,571) (242) (343) (11,247) (241) Total Non-CAPEX Investing Activities for year (outflows) or inflows Cash (used in) provided by investing activities (38,475) (48,227) (24,202) (33,774) (9,001) (22,579) (44,443) (56,274) 665 0 Financing activities: Proceeds from issuance of common stock Repurchases of common stock Proceeds from issuance of term debt, net Repayments of term debt Payments for dividends and dividend equivalents Total Other Financing Activities not related to Equity Cash Flows 530 (22,860) 16,896 730 (45,000) 11,960 543 (35,253) 27,114 0 (2,488) 125 (10,564) (381) (11,126) 5,887 (11,561) 1,441 Cash used in financing activities (1,698) (16,379) (37,549) (17,716) 1 2 3 Period End: December 31 Perpetuity 2024 $ Net sales Cost of sales Gross margin Forecasts 2020 156,508 $ 87,846 68,662 2021 170,910 $ 106,606 64,304 2022 182,795 $ 112,258 70,537 2023 233,715 140,089 93,626 Operating expenses: Research and development Selling, general and administrative Total operating expenses 3,381 10,040 13,421 4,475 10,830 15,305 6,041 11,993 18,034 8,067 14,329 22,396 EBIT Less: Interest Expense Real other income (expense), net Income before provision for income taxes Provision for income taxes Net income 55,241 566 (44) 55,763 14,030 41,733 $ 48,999 460 696 50,155 13,118 37,037 $ 52,503 815 165 53,483 13,973 39,510 $ 73,248 733 (1,466) 72,515 19,121 53,394 Cash dividends declared per share $2.65 $1.64 $1.82 $1.98


