

Question
Use the results from JMP to answer the questions below. The variables in the dataset are defined as follows. state = state (including the District
Use the results from JMP to answer the questions below.
The variables in the dataset are defined as follows.
state = state (including the District of Columbia, or DC), using two-letter postal codes,
violent = violent crime rate,
murder = murder rate,
poverty = percent below the poverty level,
single = percent of families headed by a single parent.
Here are the raw data in the Crime2 datafile:
State violent murder poverty single
AK 761 9.0 9.1 14.3
AL 780 11.6 17.4 11.5
AR 593 10.2 20.0 10.7
AZ 715 8.6 15.4 12.1
CA 1078 13.1 18.2 12.5
CO 567 5.8 9.9 12.1
CT 456 6.3 8.5 10.1
DE 686 5.0 10.2 11.4
FL 1206 8.9 17.8 10.6
GA 723 11.4 13.5 13.0
HI 261 3.8 8.0 9.1
IA 326 2.3 10.3 9.0
ID 282 2.9 13.1 9.5
IL 960 11.4 13.6 11.5
IN 489 7.5 12.2 10.8
KS 496 6.4 13.1 9.9
KY 463 6.6 20.4 10.6
LA 1062 20.3 26.4 14.9
MA 805 3.9 10.7 10.9
MD 998 12.7 9.7 12.0
ME 126 1.6 10.7 10.6
MI 792 9.8 15.4 13.0
MN 327 3.4 11.6 9.9
MO 744 11.3 16.1 10.9
MS 434 13.5 24.7 14.7
MT 178 3.0 14.9 10.8
NC 679 11.3 14.4 11.1
ND 82 1.7 11.2 8.4
NE 339 3.9 10.3 9.4
NH 138 2.0 9.9 9.2
NJ 627 5.3 10.9 9.6
NM 930 8.0 17.4 13.8
NV 875 10.4 9.8 12.4
NY 1074 13.3 16.4 12.7
OH 504 6.0 13.0 11.4
OK 635 8.4 19.9 11.1
OR 503 4.6 11.8 11.3
PA 418 6.8 13.2 9.6
RI 402 3.9 11.2 10.8
SC 1023 10.3 18.7 12.3
SD 208 3.4 14.2 9.4
TN 766 10.2 19.6 11.2
TX 762 11.9 17.4 11.8
UT 301 3.1 10.7 10.0
VA 372 8.3 9.7 10.3
VT 114 3.6 10.0 11.0
WA 515 5.2 12.1 11.7
WI 264 4.4 12.6 10.4
WV 208 6.9 22.2 9.4
WY 286 3.4 13.3 10.8
DC 2922 78.5 26.4 22.1
Please provide step-by-step questions. the bottom is the statistical result of all 51 states. Please answer the questions based on the statistics result. If you need more information let me know
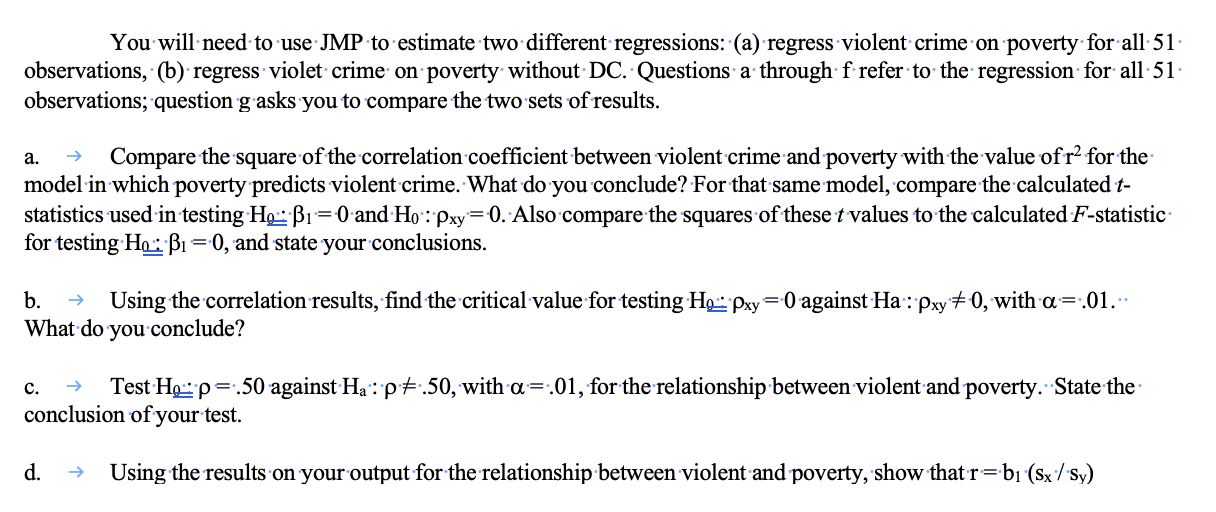
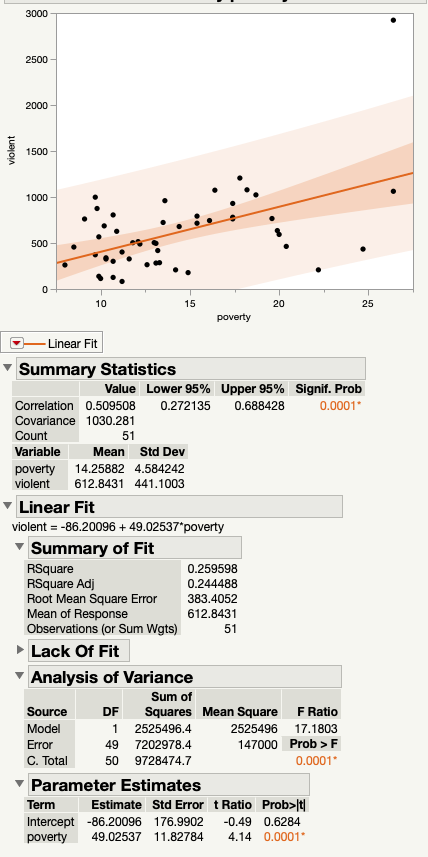
You will need to use JMP to estimate two different regressions: (a) regress violent crime on poverty for all 51 observations, ' (b) regress violet crime on poverty without DC. Questions a through f refer to the regression for all 51 observations; question g asks you to compare the two sets of results. a. Compare the square of the correlation coefficient between violent crime and poverty with the value of r2 for the model in which poverty predicts violent crime. What do you conclude? For that same model, compare the calculated t statistics used in testing H01=0 and H0xy=0. Also compare the squares of these t values to the calculated F-statistic for testing H01=0, and state your conclusions. b. Using the correlation results, find the critical value for testing H0xy=0 against Haxy==0, with =.01. What do you conclude? c. Test H0=.50 against Ha=.50, with =.01, for the relationship between violent and poverty. State the conclusion of your test. d. Using the results on your output for the relationship between violent and poverty, show that r=b1(sx/sy) Summary Statistics You will need to use JMP to estimate two different regressions: (a) regress violent crime on poverty for all 51 observations, ' (b) regress violet crime on poverty without DC. Questions a through f refer to the regression for all 51 observations; question g asks you to compare the two sets of results. a. Compare the square of the correlation coefficient between violent crime and poverty with the value of r2 for the model in which poverty predicts violent crime. What do you conclude? For that same model, compare the calculated t statistics used in testing H01=0 and H0xy=0. Also compare the squares of these t values to the calculated F-statistic for testing H01=0, and state your conclusions. b. Using the correlation results, find the critical value for testing H0xy=0 against Haxy==0, with =.01. What do you conclude? c. Test H0=.50 against Ha=.50, with =.01, for the relationship between violent and poverty. State the conclusion of your test. d. Using the results on your output for the relationship between violent and poverty, show that r=b1(sx/sy) Summary Statistics
Step by Step Solution
There are 3 Steps involved in it
Step: 1

Get Instant Access to Expert-Tailored Solutions
See step-by-step solutions with expert insights and AI powered tools for academic success
Step: 2

Step: 3
Ace Your Homework with AI
Get the answers you need in no time with our AI-driven, step-by-step assistance
Get Started
Makers And Takers The Rise Of Finance And The Fall Of American Business
Authors: Rana Foroohar
1st Edition
0553447238, 978-0553447231