Answered step by step
Verified Expert Solution
Link Copied!

Question

1 Approved Answer

Use the results from the Student Data Table to complete the following problems. Make sure to show all work/calculations. Calculate the Pearson correlation between hand

Use the results from theStudent Data Table to complete the following problems. Make sure to show all work/calculations.

  1. Calculate the Pearson correlation between hand and foot size for students in the Student Data Table. Graph the relationship, determine a hypothesis to test this relationship, and statistically test this hypothesis using alpha=0.05. Interpret all results in a paragraph citing the appropriate statistics.

  1. Calculate the simple linear regression to determine if the amount of sleep (y) can be predicted by time spent on homework (x). Graph the relationship and determine, numerically, if there are any outliers. Interpret all results in a paragraph citing the appropriate statistics.

A grading rubric for Written Assignment 6 can be found in the Evaluation Rubrics folder in Moodle.
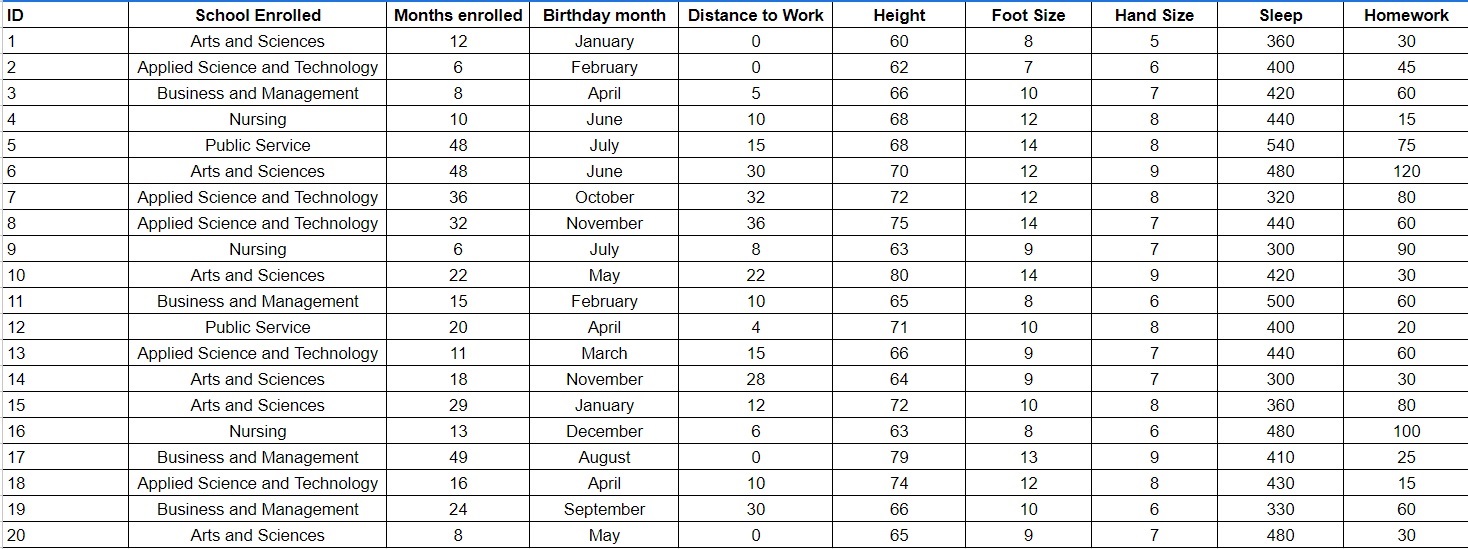
image text in transcribed
ID School Enrolled Months enrolled Birthday month Distance to Work Height Foot Size Hand Size Sleep Homework Arts and Sciences 12 January 60 8 5 360 30 Applied Science and Technology 6 February 0 62 7 6 400 45 Business and Management 8 D UI A W N - April 5 66 10 7 420 60 Nursing 10 June 10 68 12 8 440 15 Public Service 48 July 15 68 14 8 540 75 Arts and Sciences 48 June 30 70 12 9 480 120 Applied Science and Technology 36 October 32 72 12 8 320 80 CO Applied Science and Technology 32 November 36 75 14 7 440 60 9 Nursing 6 July 8 63 9 7 300 90 10 Arts and Sciences 22 May 22 80 14 420 30 11 Business and Management 15 February 10 65 8 6 500 60 12 Public Service 20 April 4 71 10 8 400 20 13 Applied Science and Technology 11 March 15 66 9 7 440 60 14 Arts and Sciences 18 November 28 64 9 7 300 30 15 Arts and Sciences 29 January 12 72 10 8 360 80 16 Nursing 13 December 6 63 8 6 480 100 17 Business and Management 49 August 0 79 13 9 410 25 18 Applied Science and Technology 16 April 10 74 12 8 430 15 19 Business and Management 24 September 30 66 10 6 330 60 20 Arts and Sciences 8 May 0 65 9 7 480 30

Step by Step Solution

There are 3 Steps involved in it

Step: 1

blur-text-image

Get Instant Access to Expert-Tailored Solutions

See step-by-step solutions with expert insights and AI powered tools for academic success

Step: 2

blur-text-image

Step: 3

blur-text-image

Ace Your Homework with AI

Get the answers you need in no time with our AI-driven, step-by-step assistance

Get Started

Recommended Textbook for

Linear Algebra and Its Applications

Authors: Gilbert Strang

4th edition

30105678, 30105676, 978-0030105678

More Books

Students also viewed these Mathematics questions