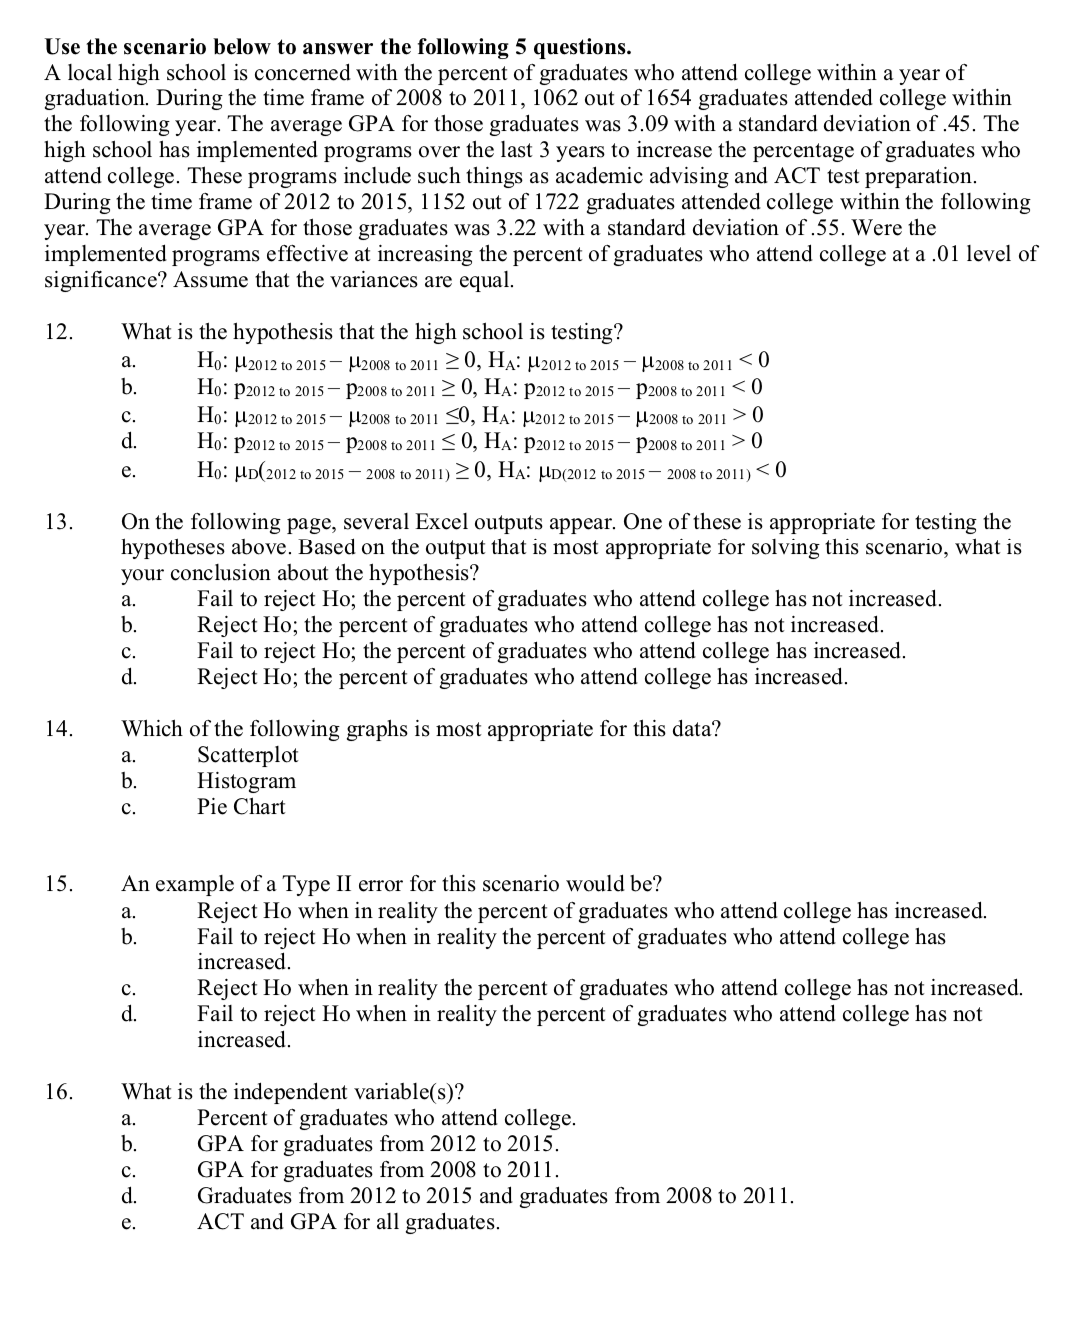
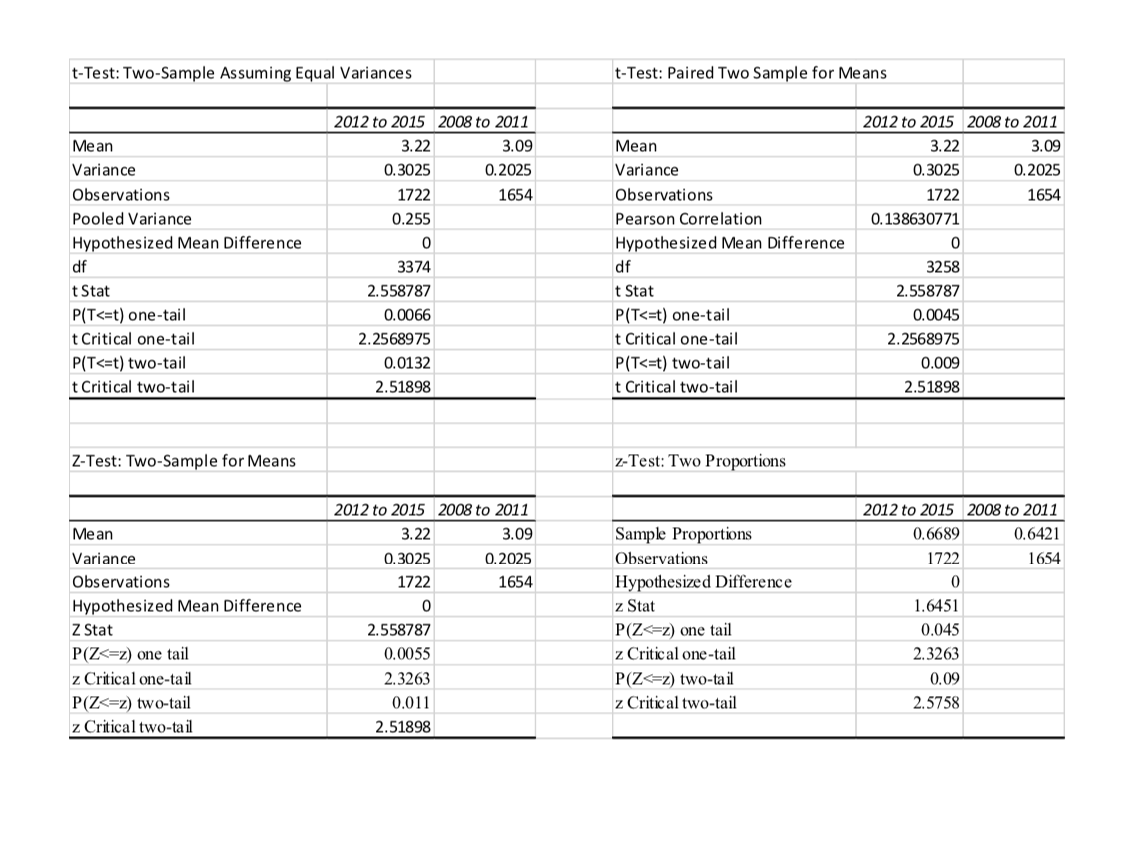
Use the scenario below to answer the following 5 questions. A local high school is concerned with the percent of graduates who attend college within a year of graduation. During the time frame of 2003 to 2011, 1062 out of 1654 graduates attended college within the following year. The average GPA for those graduates was 3 .09 with a stande deviation of .45. The high school has implemented programs over the last 3 years to increase the percentage of graduates who attend college. These programs include such things as academic advising and ACT test preparation. During the time frame of 2012 to 2015, 1152 out of 1722 graduates attended college within the following year. The average GPA for those graduates was 3.22 with a standard deviation of .55. Were the implemented programs effective at increasing the percent of graduates who attend college at a .01 level of signicance? Assume that the variances are equal. 12. What is the hypothesis that the high school is testing? Ho: 11201210 2015 112008102011 2 0, HA: 11201210 2015 112008102011 '5 0 Ho: p2012to 2015 1320031020112 0, Ha: p2012t02015 132008102011\": 0 :Hzmzmzms- 11200810201150, Ha: Hzmzmzms- 112008102011} 0 Ho: p2012to 2015 [320031020113 0, Ha: p2012t02015 132008102011) 0 09.0975 : D Ho: Hobmzmzmszoos 102011} 2 0, HA: 1102012 tozols zoosmzon} 0 13. On the following page, several Excel outputs appear. One of these is appropriate for testing the hypotheses above. Based on the output that is most appropriate for solving this scenario, what is your conclusion about the hypothesis? a. Fail to reject Ho; the percent of graduates who attend college has not increased. b. Reject Ho; the percent of graduates who attend college has not increased. c. Fail to reject Ho; the percent of graduates who attend college has increased. d. Reject Ho; the percent of graduates who attend college has increased. 14. Which of the following graphs is most appropriate for this data? a. Scatterplot b. Histogram c. Pie Chart 15. An example of a Type II error for this scenario would be? a. Reject Ho when in reality the percent of graduates who attend college has increased. b. Fail to reject Ho when in reality the percent of graduates who attend college has increased. c. Reject Ho when in reality the percent of graduates who attend college has not increased. d. Fail to reject Ho when in reality the percent of graduates who attend college has not increased. 16. What is the independent variable(s)? Percent of graduates who attend college. GPA for graduates from 2012 to 2015. GPA for graduates from 2003 to 2011. Graduates from 2012 to 2015 and graduates from 2008 to 2011. ACT and GPA for all graduates. nap-.013. t-Test: Two-Sample Assuming Equal Variances t-Test: Paired Two Sample for Means 2012 to 2015 2008 to 2011 2012 to 2015 2008 to 2011 Mean 3.22 3.09 Mean 3.22 3.09 Variance 0.3025 0.2025 Variance 0.3025 0.2025 Observations 1722 1654 Observations 1722 1654 Pooled Variance 0.255 Pearson Correlation 0. 138630771 Hypothesized Mean Difference 0 Hypothesized Mean Difference di 3374 df 3258 t Stat 2.558787 t Stat 2.558787 P(T


