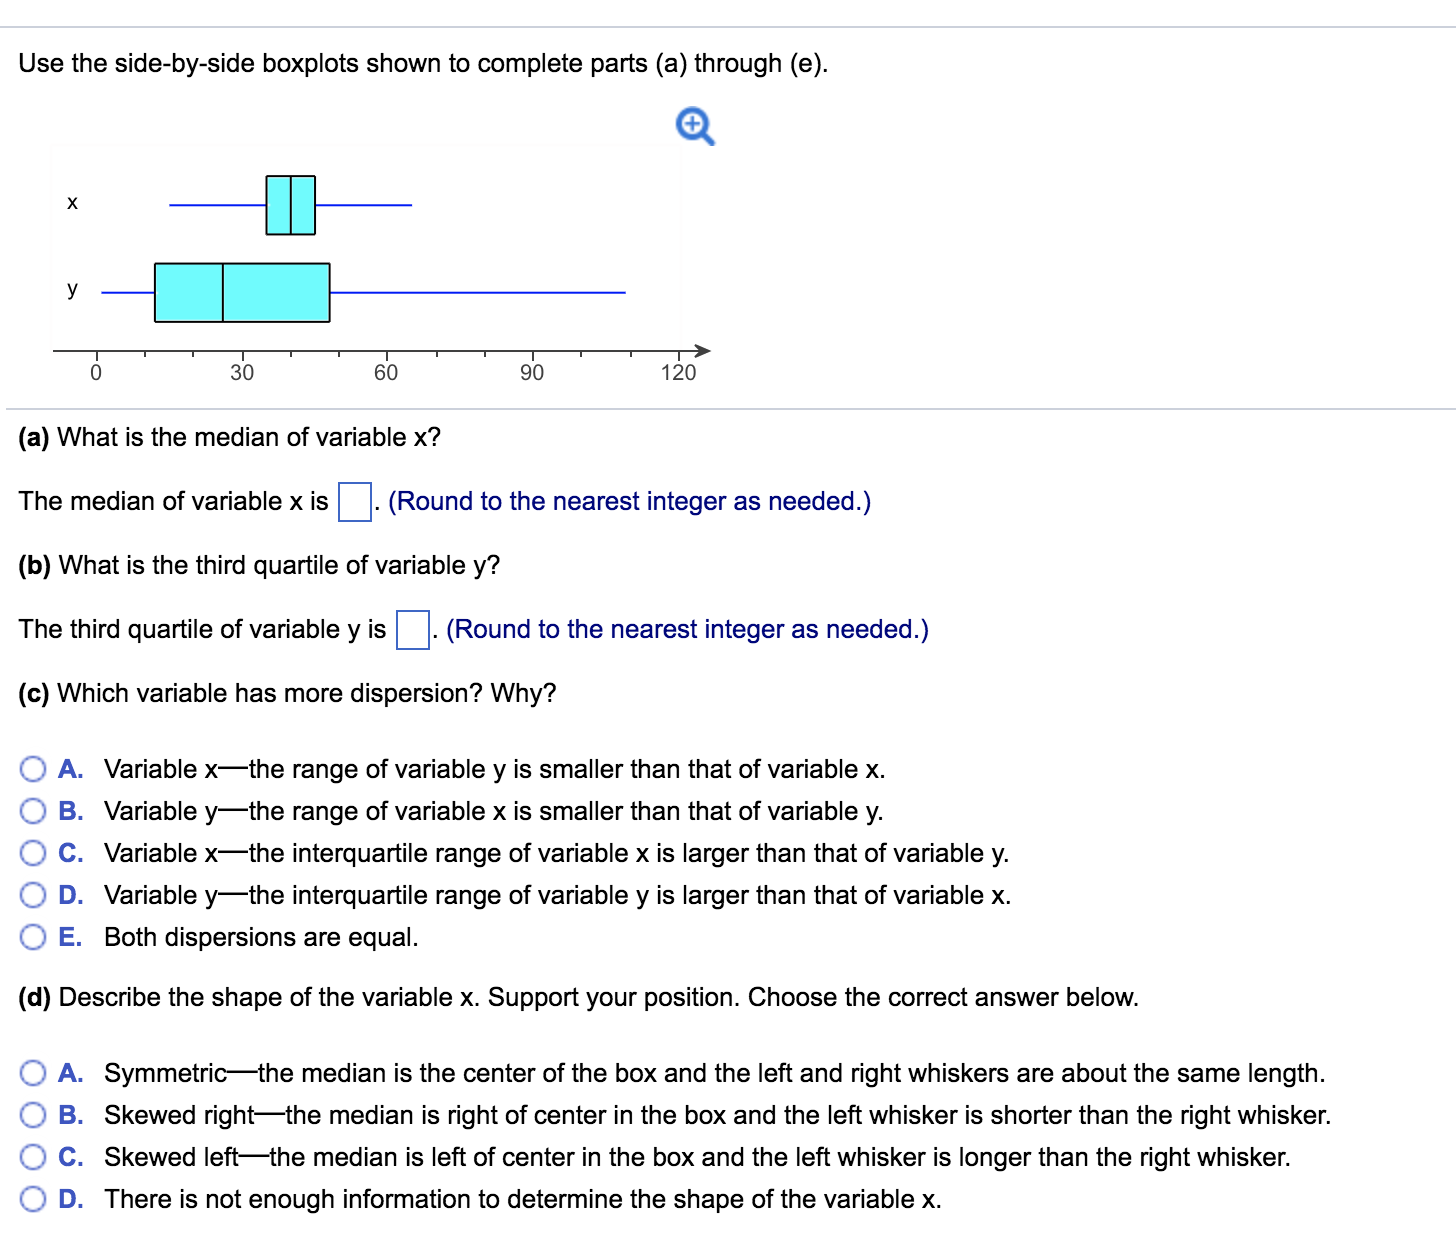
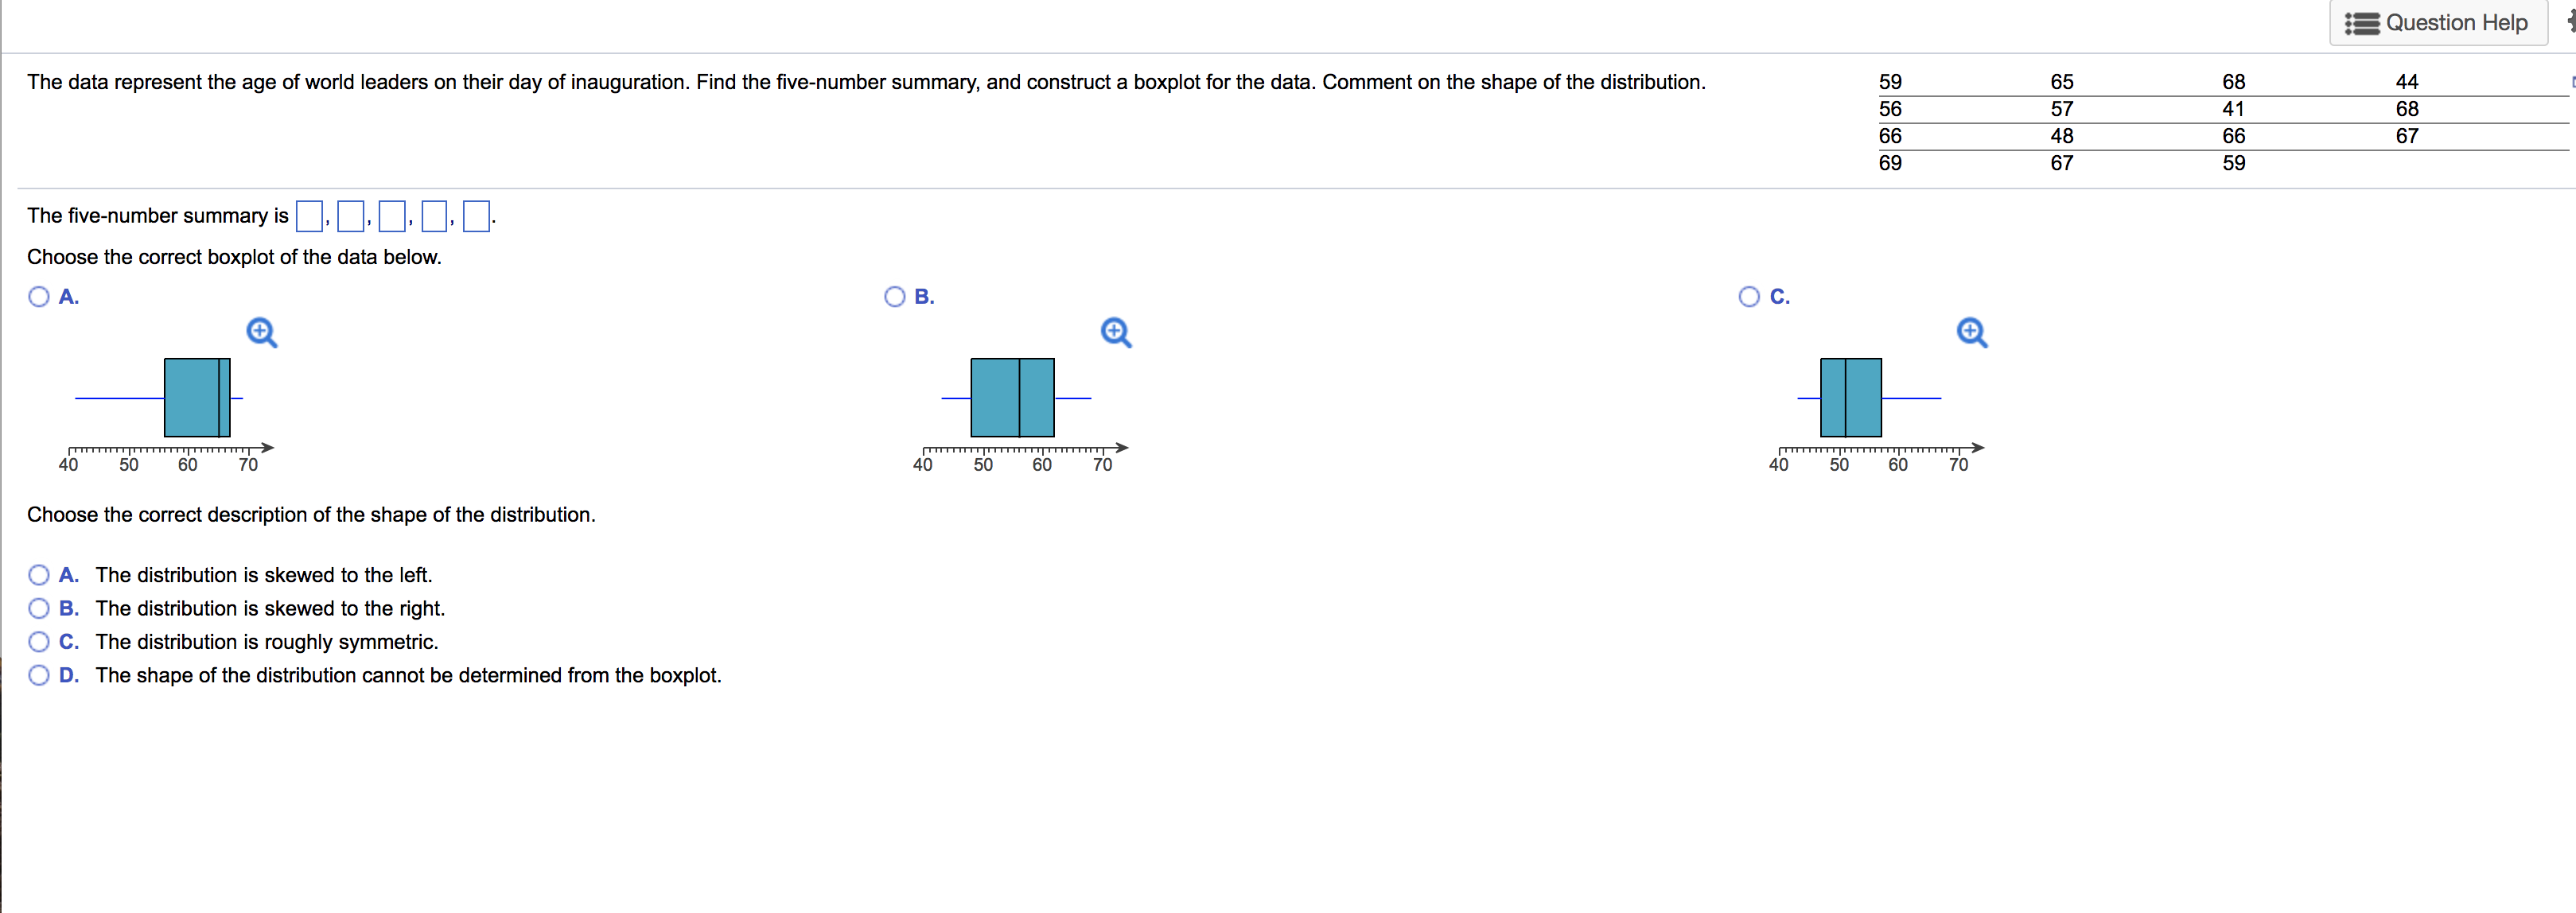
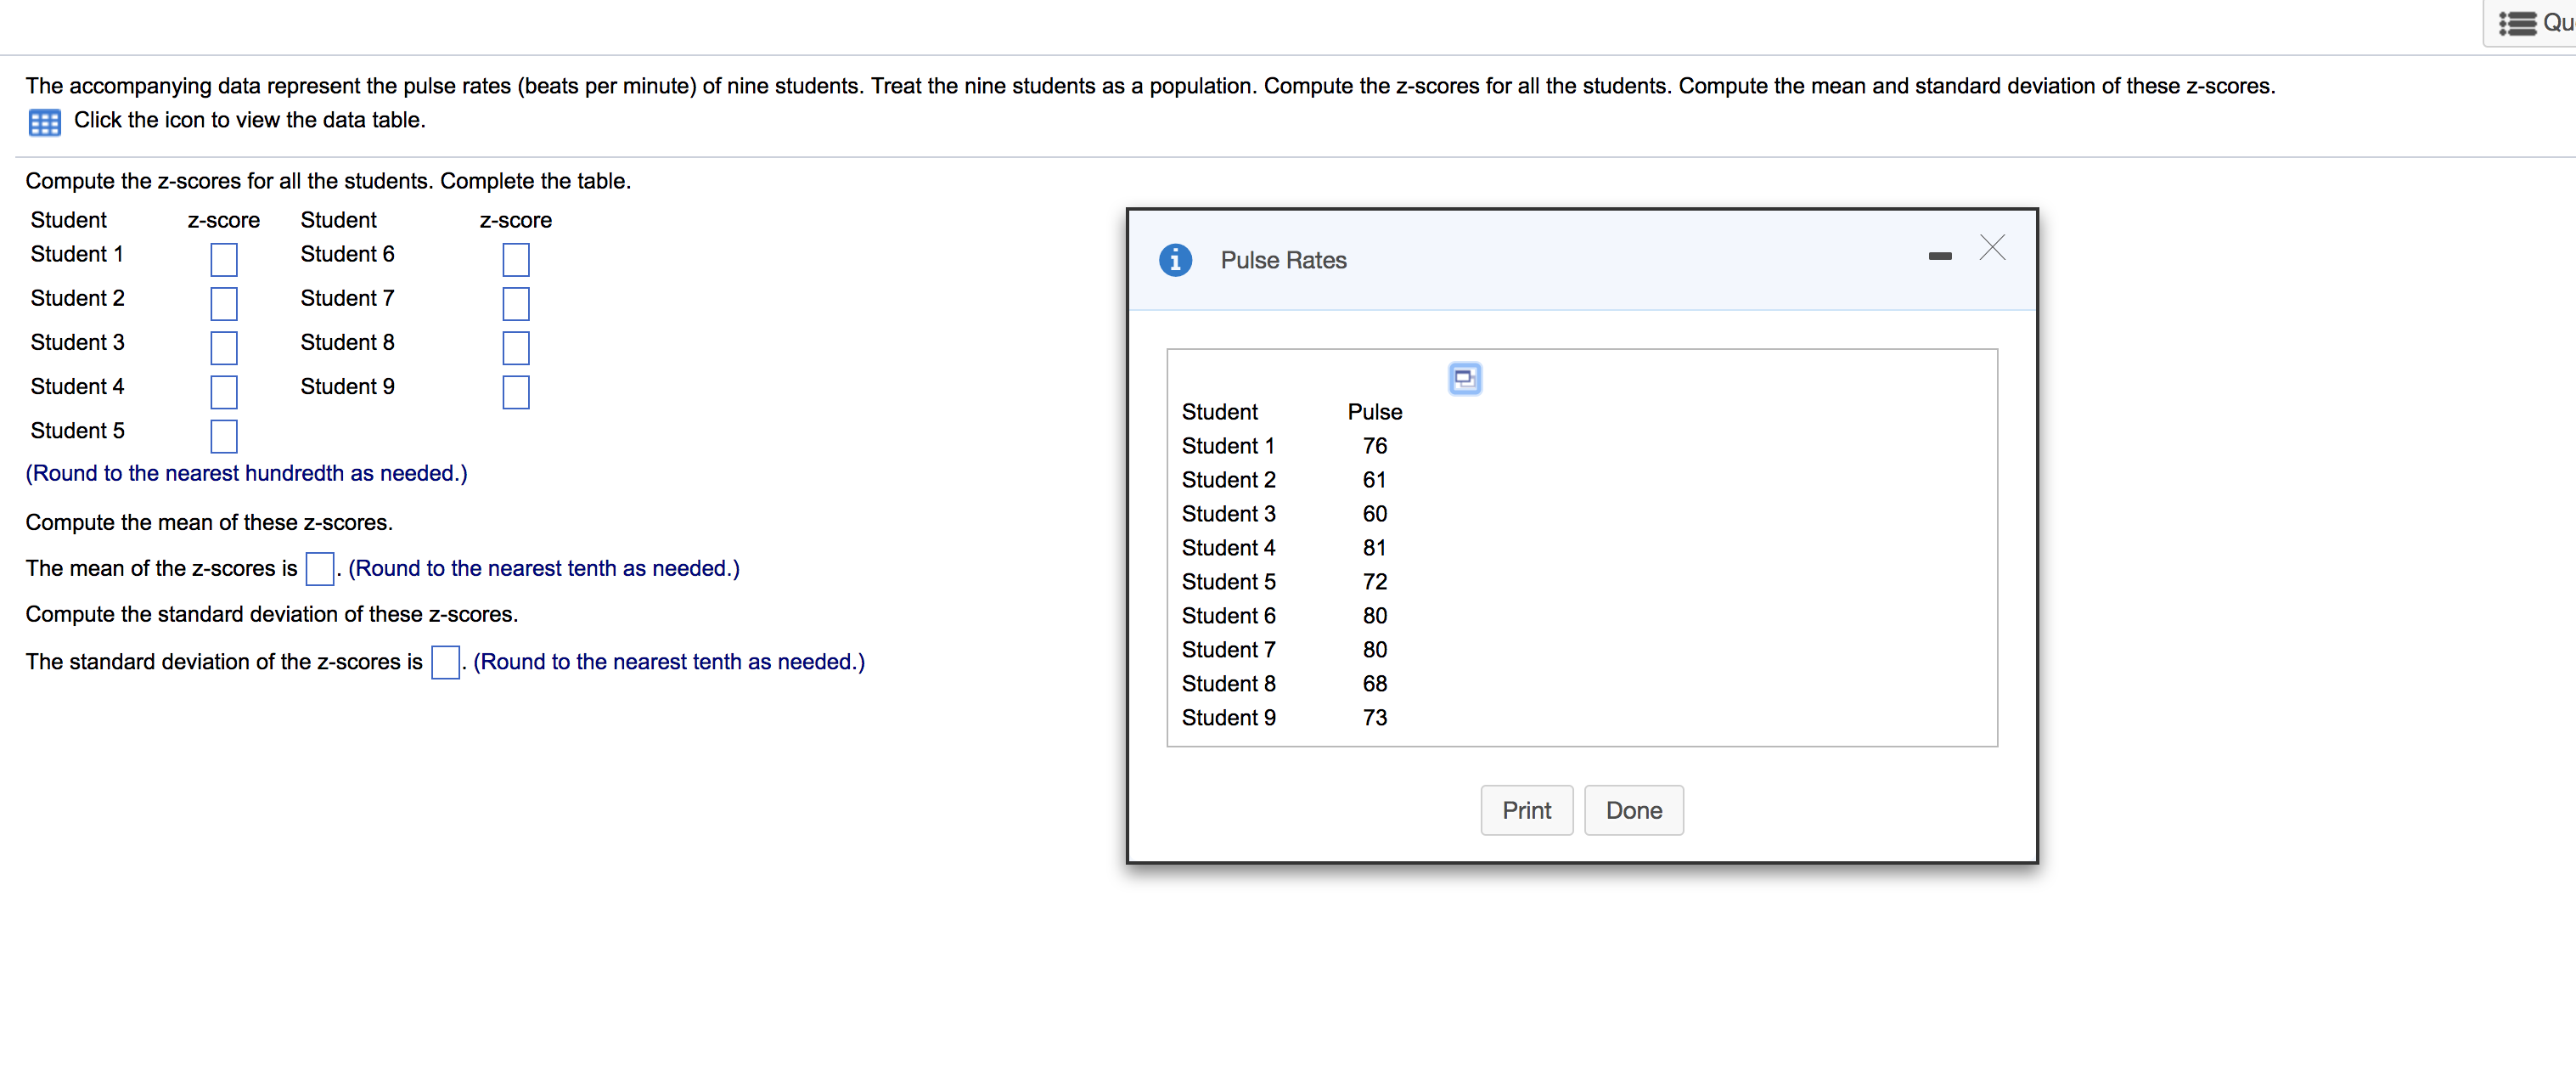
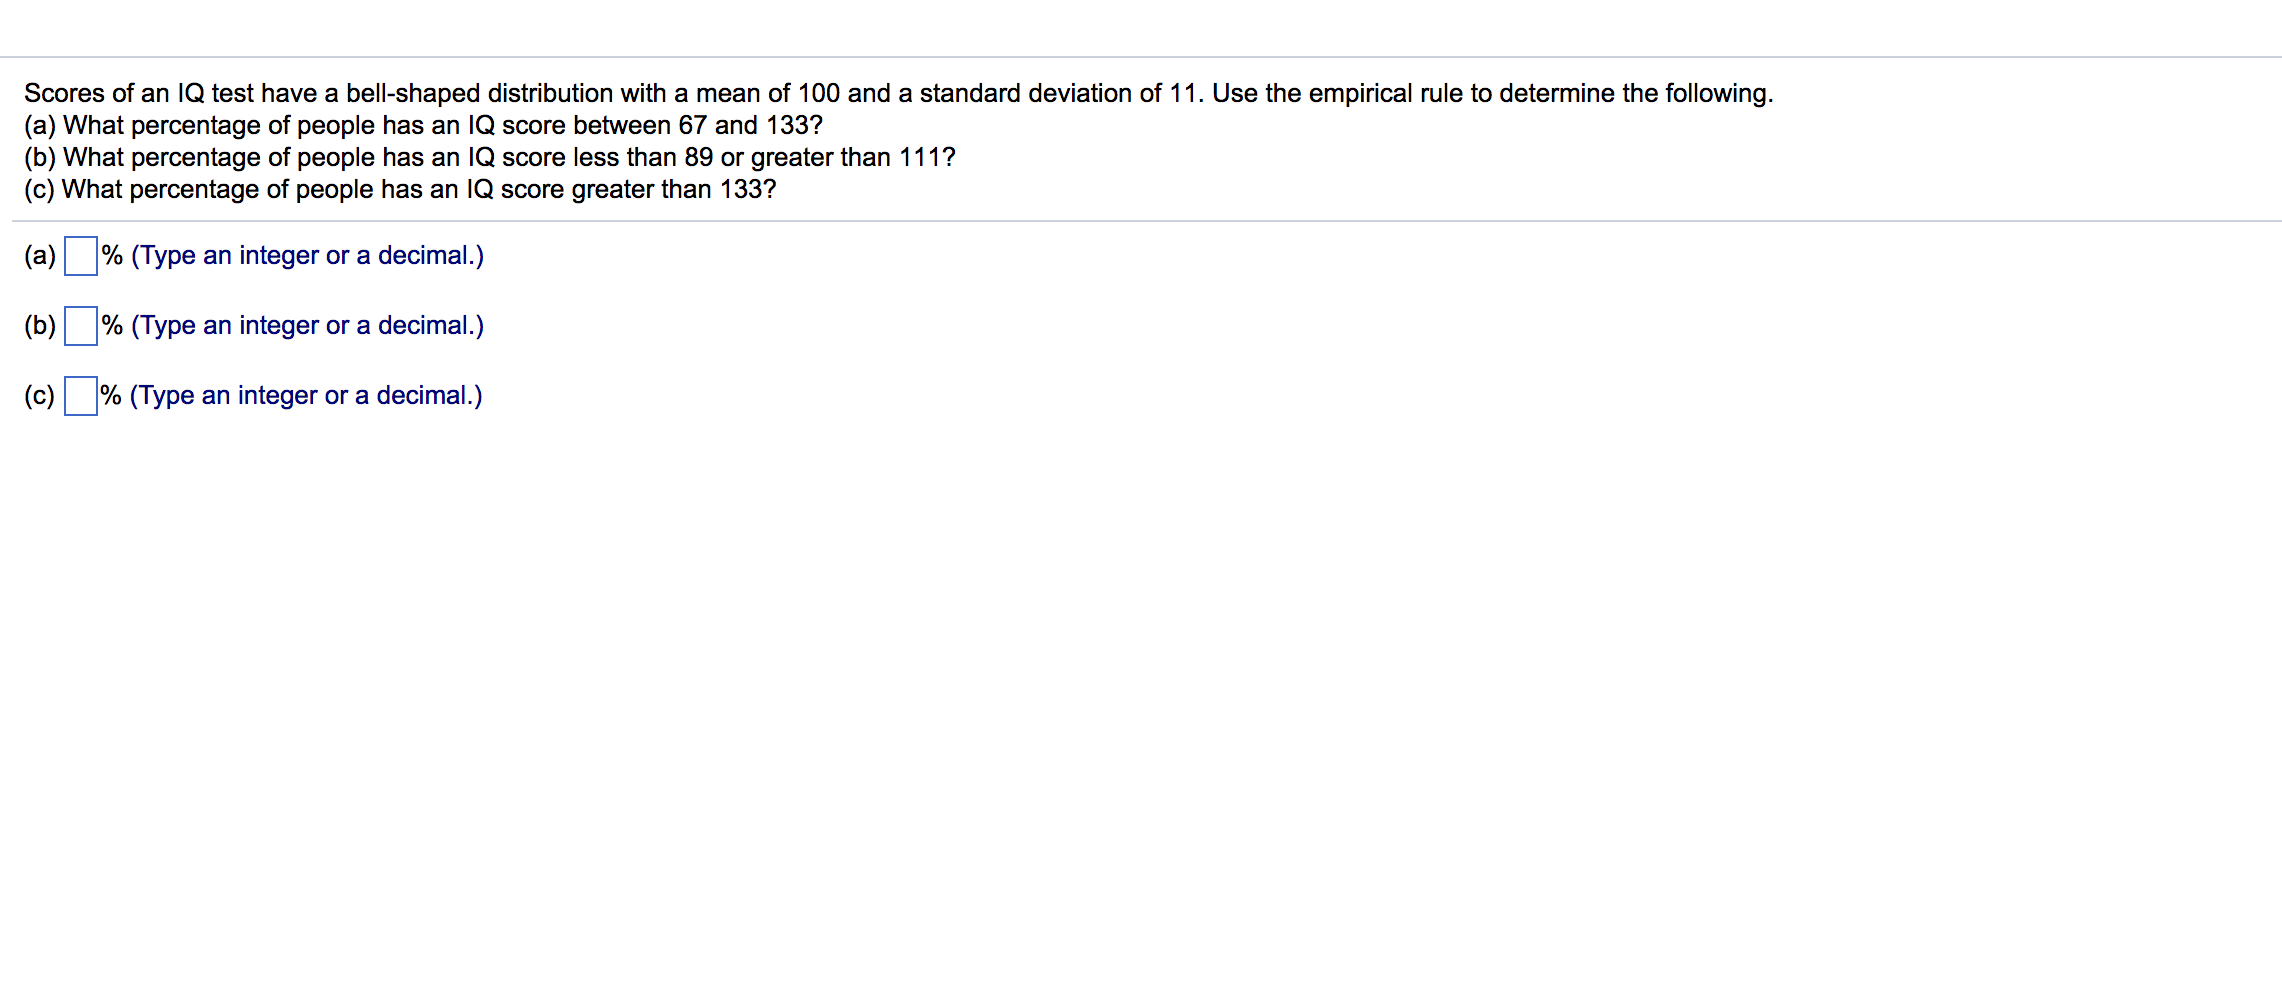
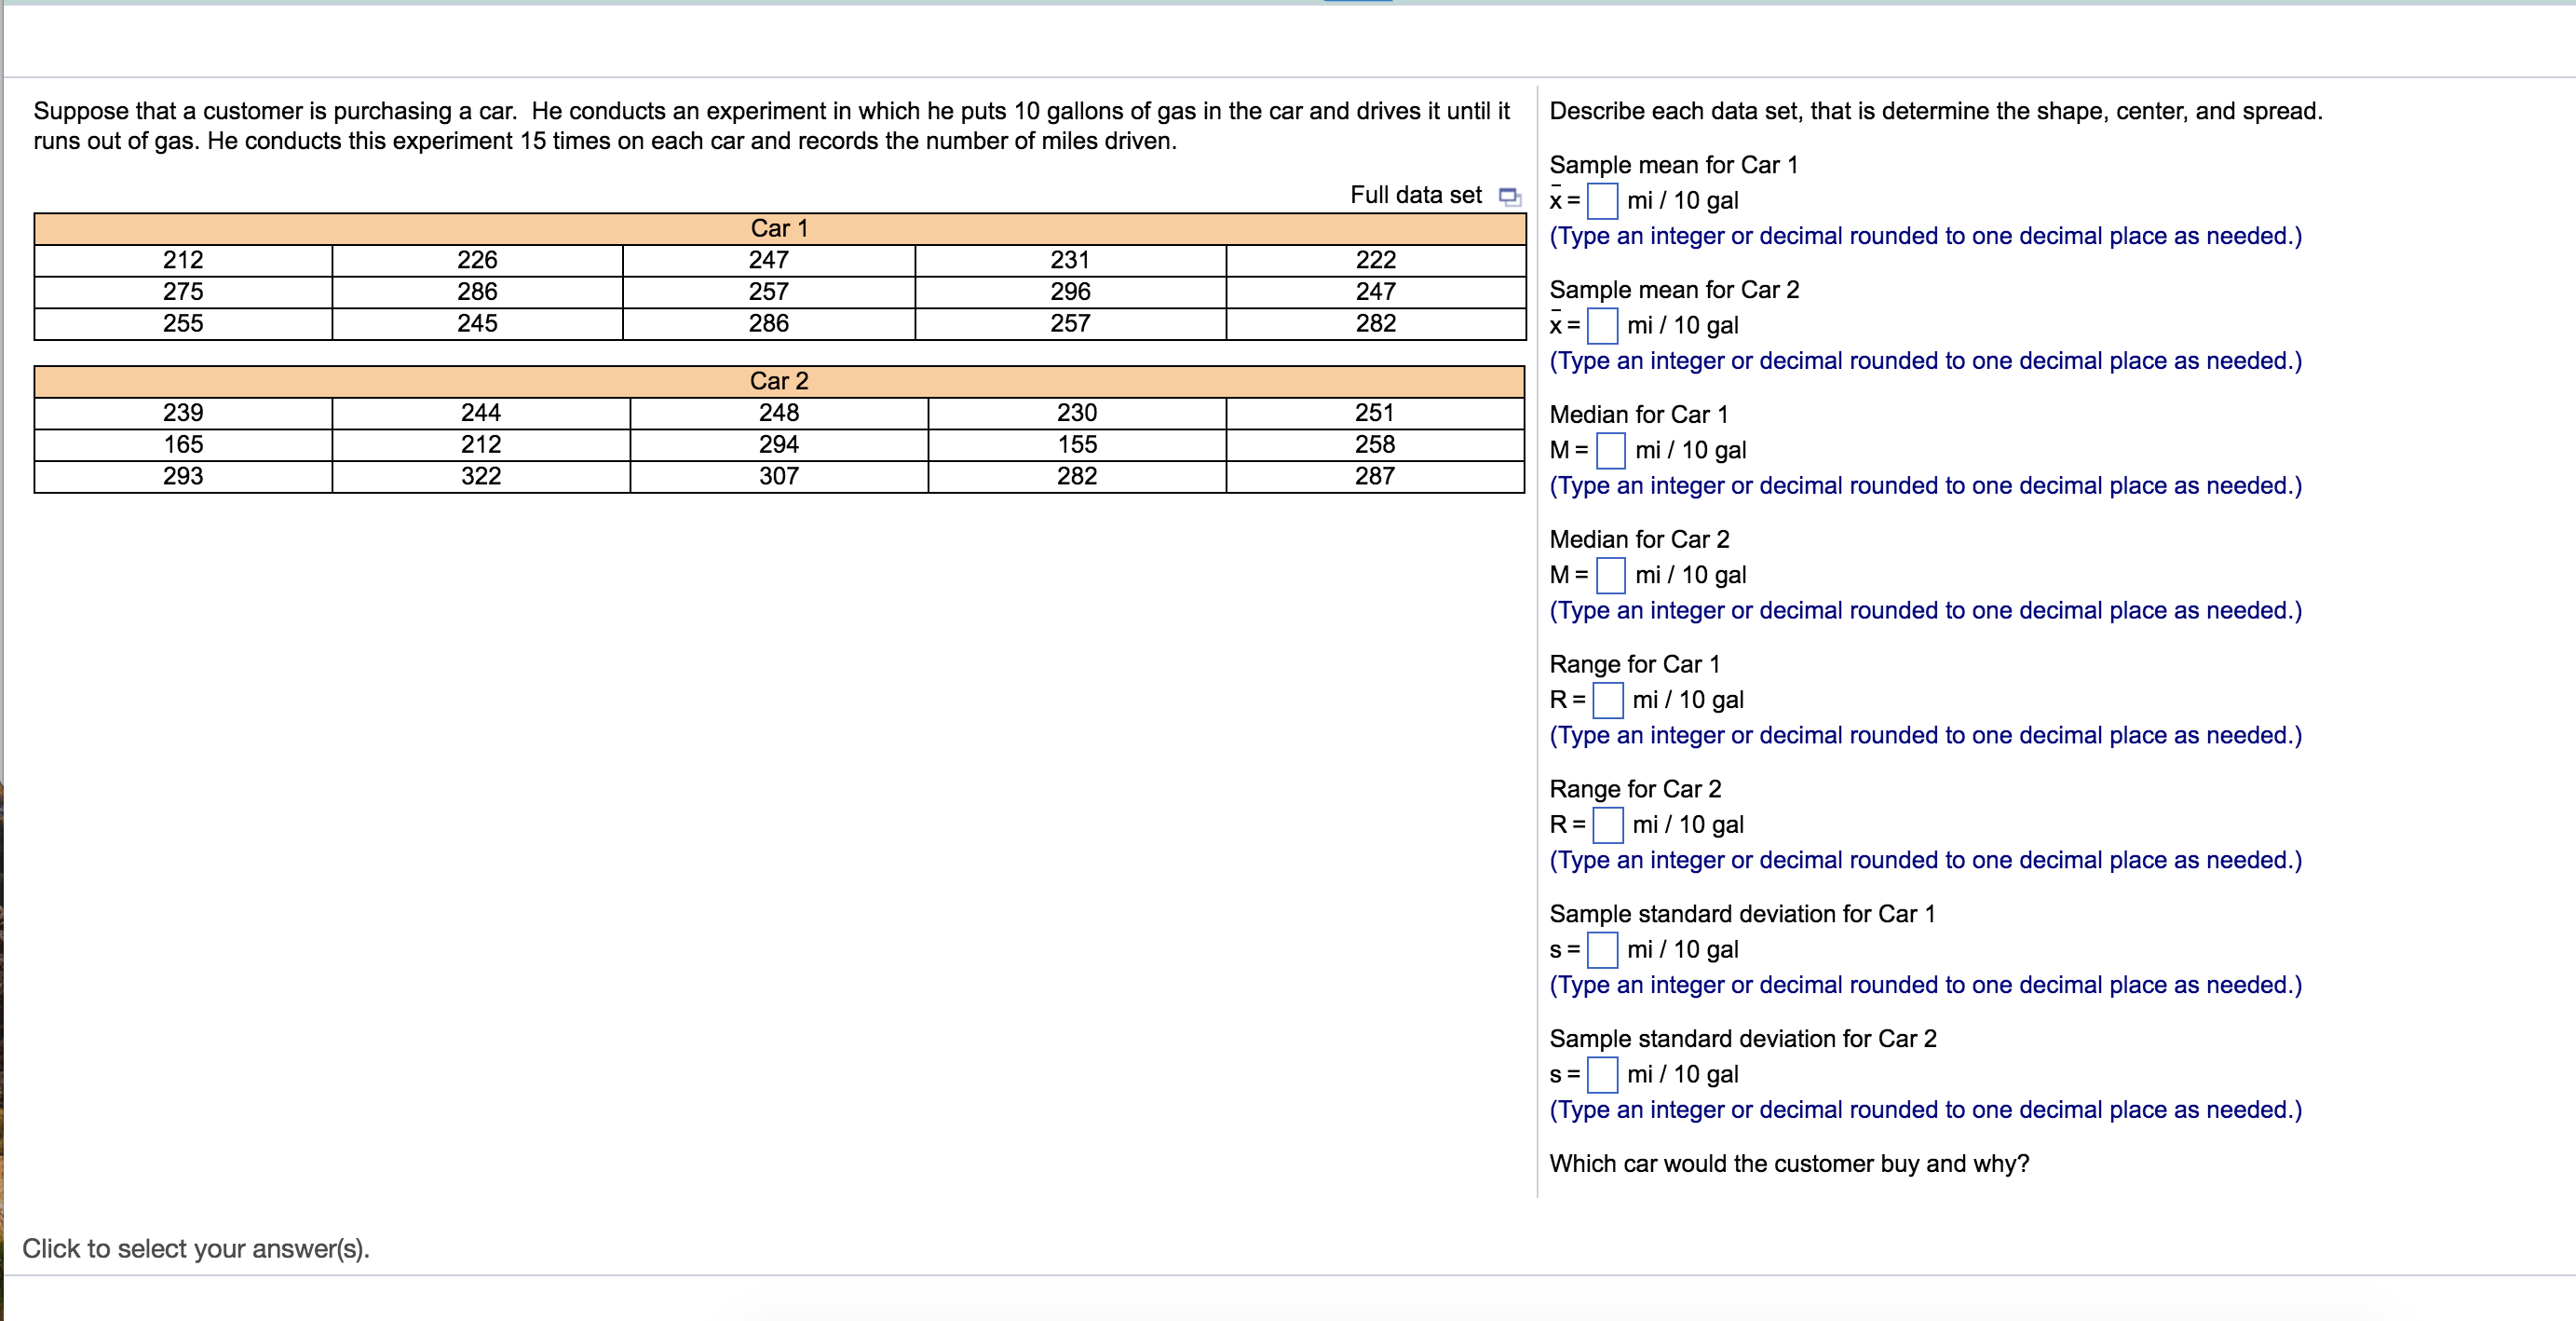
Use the side-by-side boxplots shown to complete parts (a) through (e). Q x _m_ v5 0 30 60 90 120 (a) What is the median of variable x? The median of variable x is D. (Round to the nearest integer as needed.) (b) What is the third quartile of variable y? The third quartile of variable y is D. (Round to the nearest integer as needed.) (c) Which variable has more dispersion? th? O A. Variable xthe range of variable y is smaller than that of variable x. O B. Variable ythe range of variable x is smaller than that of variable y. 0 C. Variable xthe interquartile range of variable x is larger than that of variable y. 0 D. Variable ythe interquartile range of variable y is larger than that of variable x. O E. Both dispersions are equal. (cl) Describe the shape of the variable x. Support your position. Choose the correct answer below. 0 A. Symmetricthe median is the center of the box and the left and right whiskers are about the same length. 0 B. Skewed rightthe median is right of center in the box and the left whisker is shorter than the right whisker. O C. Skewed leftthe median is left of center in the box and the left whisker is longer than the right whisker. O D. There is not enough information to determine the shape of the variable x. 35 Question Help t The data represent the age of worid leaders on their day of inauguration. Find the five-number summary. and construct a boxplct (or the data. Comment on the shape cf the distribution. Theve-numbersummaryis , , , , Choose the correct boxplot of the data belcw. O A- O B. O c_ Q a Q 4 I f 40 50 50 70 M] 50 so 10 40 50 50 7D choose the correct description of the shape of the distribution, 0 A The distribution is skewed to the left. O B' The distribution is skewed m the right. 0 C. The distribution is roughly symmetric. O D. The shape of the distribution cannot be determined tram the boxplct. 59 65 68 44 56 57 41 68 66 48 66 67 69 67 59 The accompanying data represent the pulse rates (beats per minute) of nine students. Treat the nine students as a population Compute the z-soores for all the students. Compute the mean and standard deviation of these z-soores. a Click the icon to view the data table. Compute the z-soores for all the students. Complete the table. Student z-eoore Student 1 Student 2 Student 3 Student 4 Student 5 Student zscore Student 6 Student 7 Student 8 Student 9 (Round to the nearest hundredth as needed) Compute the mean of these The mean of the 2-5me is z-scores, . (Round to the nearest tenth as needed) Compute the standard deviation of these z-soores. The standard deviation of th e 2-soores is t (Round to the nearest tenth as needed.) 0 Pulse Rates Student Student 1 Student 2 Student 3 Student 4 Student 5 Student 6 Student 7 Student 8 Student 9 Print Done ii Scores of an IQ test have a bell-shaped distribution with a mean of 100 and a standard deviation of 11. Use the empirical rule to determine the following. (a) What percentage of people has an IQ score between 67 and 133? (b) What percentage of people has an IQ score less than 89 or greater than 111'? (c) What percentage of people has an IQ score greater than 133? (a) % (Type an integer or a decimal.) (b) % (Type an integer or a decimal.) (c) % (Type an integer or a decimal.) Suppose that a customer is purchasing a car. He conducts an experiment in which he puts 10 gallons of gas in the car and drives it until it runs out of gas. He conducts this experiment 15 times on each car and records the number of miles driven. Describe each data set, that is determine me shape, center, and spread. Sample mean for Car 1 i = mi I 10 gal (Type an integer or decimal rounded to one decimal place as needed.) Sample mean for Car 2 x = mil 10 gal (Type an integer or decimal rounded to one decimal place as needed.) Median for Car 1 Full data set 12; Car 1 212 226 247 231 222 275 286 257 296 247 255 245 286 257 232 Car 2 239 244 248 230 251 165 212 294 155 258 293 322 307 282 287 Click to select your answer(s). M = mi / 10 gal (Type an integer or decimal rounded to one decimal place as needed.) Median for Car 2 M = mi / 10 gal (Type an integer or decimal rounded to one decimal place as needed.) Range for Car 1 R = mi / 10 gal (Type an integer or decimal rounded to one decimal place as needed.) Range for Car 2 R = mi / 10 gal (Type an integer or decimal rounded to one decimal place as needed.) Sample standard deviation for Car 1 s = mi I 10 gal (Type an integer or decimal rounded to one decimal place as needed.) Sample standard deviation for Car 2 s = mil 10 gal (Type an integer or decimal rounded to one decimal place as needed.) Which car would the customer buy and why
