

Answered step by step
Verified Expert Solution
Question
1 Approved Answer
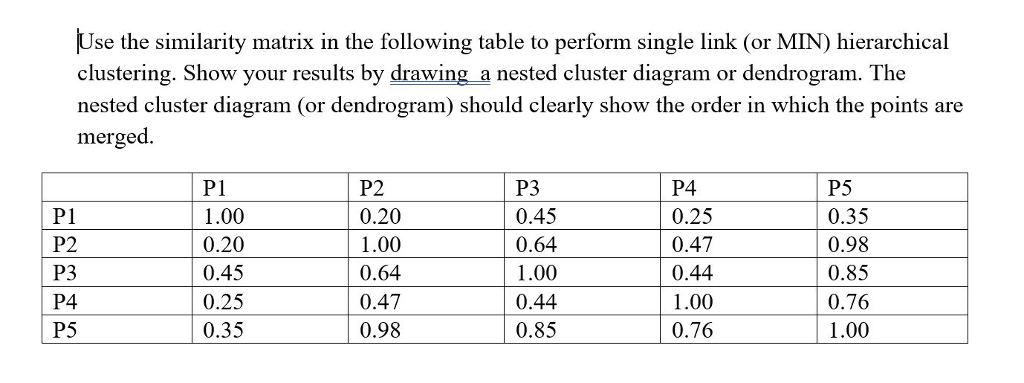
Use the similarity matrix in the following table to perform single link (or MIN) hierarchical clustering. Show your results by drawing a nested cluster diagram
Step by Step Solution
There are 3 Steps involved in it
Step: 1

Get Instant Access to Expert-Tailored Solutions
See step-by-step solutions with expert insights and AI powered tools for academic success
Step: 2

Step: 3
Ace Your Homework with AI
Get the answers you need in no time with our AI-driven, step-by-step assistance
Get Started
Objects And Databases Third International Conference Icoodb 2010 Frankfurt/Main Germany September 28 30 2010 Proceedings Lncs 6348
Authors: Alan Dearle ,Roberto V. Zicari
2010th Edition
3642160913, 978-3642160912