Answered step by step
Verified Expert Solution
Link Copied!

Question

1 Approved Answer

Use the table of means and the table of coefficients to answer the questions about elasticity and demand for professional sports tickets. The MLB stands

Use the table of means and the table of coefficients to answer the questions about elasticity and demand for professional sports tickets. The MLB stands for major league baseball, NBA stands for National Basketball Association and NFL stands for National Football League.
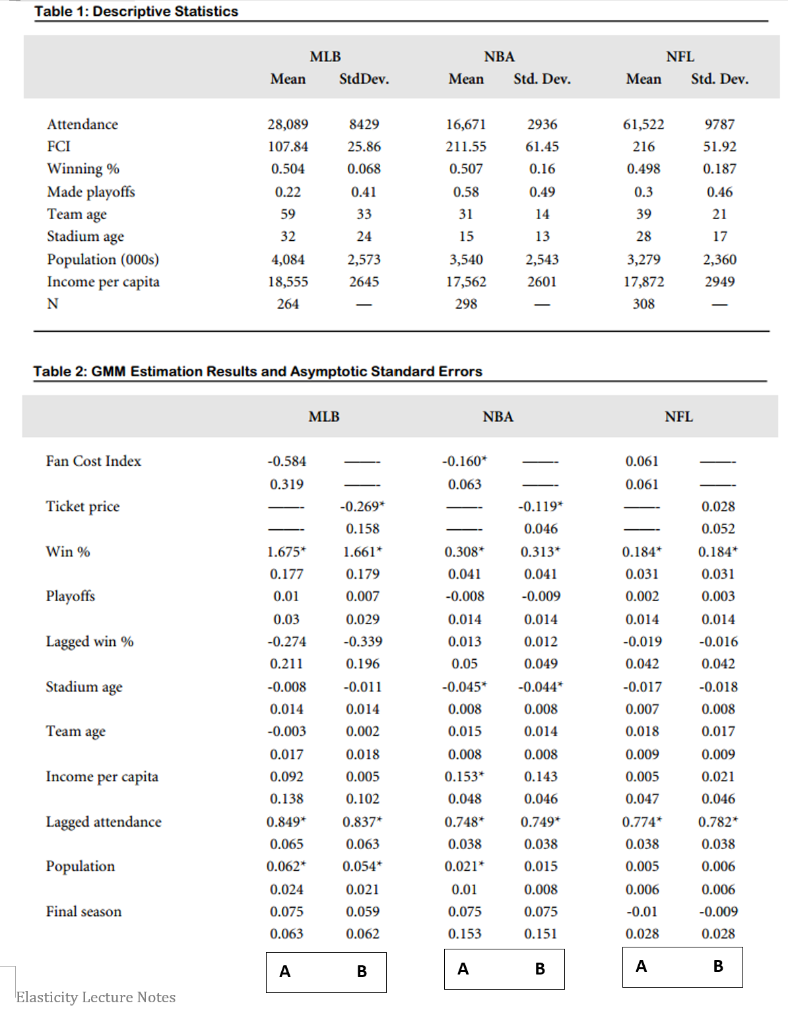
image text in transcribed

In the second table, each row has two numbers: the number on the top is the coefficient and the number below is the standard error. For example, the coefficient for win % is 1.675 for MLB (the standard error is 0.177). The first column of numbers for each sport estimates demand using the fan cost index and the second column uses the ticket price.

The first table does not include the average prices, however, here they are:

MLB average ticket price = $38 ; NBA average ticket price = $79; NFL average ticket price = $118. Attendance should be divided by 1000 units. i.e. attendance of 28,568 should be thought of as 28.568.

  1. What is the ticket price elasticity for each sport, MLB, NFL and NBA? Show all math. [Use column B for each sport in table 2 to calculate Price elasticity]
  2. What is the fan cost index price elasticity for each sport (MLB, NFL and NBA)? The fan cost index (FCI) includes the cost of a hat, soda, hotdog and parking. Explain why the FCI elasticity and the ticket price elasticity are so different. What is the interpretation of the FCI elasticity? [Use column A for each sport in table 2 to calculate Fan Cost Index elasticity]
  3. What is the per capita income elasticity for each sport? Show all math. [Use column A for each sport to calculate this elasticity]
  4. Provide two take-aways or policy implications regarding the sets of elasticities you have calculated. Explain your policy and the economics behind the policy.
Table 1: Descriptive Statistics NBA MLB Mean StdDev. NFL Mean Std. Dev. Mean Std. Dev. 8429 25.86 2936 61.45 Attendance FCI Winning % Made playoffs 61,522 216 0.498 0.3 16,671 211.55 0.507 0.58 31 9787 51.92 0.187 0.068 0.16 0.41 28,089 107.84 0.504 0.22 59 32 4,084 18,555 264 0.49 14 0.46 21 33 Team age Stadium age 39 24 15 13 28 17 2,543 3,279 Population (000) Income per capita N 2,573 2645 3,540 17,562 298 2,360 2949 2601 17,872 308 Table 2: GMM Estimation Results and Asymptotic Standard Errors MLB NBA NFL Fan Cost Index -0.584 -0.160* 0.063 0.061 0.061 0.319 Ticket price -0.269 0.158 1.661 -0.119 0.046 0.028 0.052 Win % 1.675* 0.177 0.179 0.184 0.031 0.002 0.014 0.184 0.031 0.003 0.014 Playoffs 0.01 0.313* 0.041 -0.009 0.014 0.012 0.049 0.007 0.03 0.308* 0.041 -0.008 0.014 0.013 0.05 -0.045* 0.008 Lagged win % 0.029 -0.339 0.196 -0.274 0.211 -0.016 0.042 Stadium age -0.011 -0.008 0.014 -0.019 0.042 -0.017 0.007 0.018 0.014 0.002 -0.018 0.008 0.017 Team age -0.003 0.015 0.017 0.092 0.018 0.005 Income per capita -0.044" 0.008 0.014 0.008 0.143 0.046 0.749 0.038 0.015 0.009 0.005 0.047 0.009 0.021 0.046 Lagged attendance 0.138 0.849* 0.065 0.062* 0.024 0.008 0.153* 0.048 0.748* 0.038 0.021 0.01 0.075 0.153 0.102 0.837* 0.063 0.054 Population 0.774 0.038 0.005 0.006 -0.01 0.782* 0.038 0.006 0.006 -0.009 0.021 Final season 0.059 0.075 0.063 0.008 0.075 0.151 0.062 0.028 0.028 B A A A B B Elasticity Lecture Notes Table 1: Descriptive Statistics NBA MLB Mean StdDev. NFL Mean Std. Dev. Mean Std. Dev. 8429 25.86 2936 61.45 Attendance FCI Winning % Made playoffs 61,522 216 0.498 0.3 16,671 211.55 0.507 0.58 31 9787 51.92 0.187 0.068 0.16 0.41 28,089 107.84 0.504 0.22 59 32 4,084 18,555 264 0.49 14 0.46 21 33 Team age Stadium age 39 24 15 13 28 17 2,543 3,279 Population (000) Income per capita N 2,573 2645 3,540 17,562 298 2,360 2949 2601 17,872 308 Table 2: GMM Estimation Results and Asymptotic Standard Errors MLB NBA NFL Fan Cost Index -0.584 -0.160* 0.063 0.061 0.061 0.319 Ticket price -0.269 0.158 1.661 -0.119 0.046 0.028 0.052 Win % 1.675* 0.177 0.179 0.184 0.031 0.002 0.014 0.184 0.031 0.003 0.014 Playoffs 0.01 0.313* 0.041 -0.009 0.014 0.012 0.049 0.007 0.03 0.308* 0.041 -0.008 0.014 0.013 0.05 -0.045* 0.008 Lagged win % 0.029 -0.339 0.196 -0.274 0.211 -0.016 0.042 Stadium age -0.011 -0.008 0.014 -0.019 0.042 -0.017 0.007 0.018 0.014 0.002 -0.018 0.008 0.017 Team age -0.003 0.015 0.017 0.092 0.018 0.005 Income per capita -0.044" 0.008 0.014 0.008 0.143 0.046 0.749 0.038 0.015 0.009 0.005 0.047 0.009 0.021 0.046 Lagged attendance 0.138 0.849* 0.065 0.062* 0.024 0.008 0.153* 0.048 0.748* 0.038 0.021 0.01 0.075 0.153 0.102 0.837* 0.063 0.054 Population 0.774 0.038 0.005 0.006 -0.01 0.782* 0.038 0.006 0.006 -0.009 0.021 Final season 0.059 0.075 0.063 0.008 0.075 0.151 0.062 0.028 0.028 B A A A B B Elasticity Lecture Notes

Step by Step Solution

There are 3 Steps involved in it

Step: 1

blur-text-image

Get Instant Access to Expert-Tailored Solutions

See step-by-step solutions with expert insights and AI powered tools for academic success

Step: 2

blur-text-image

Step: 3

blur-text-image

Ace Your Homework with AI

Get the answers you need in no time with our AI-driven, step-by-step assistance

Get Started

Recommended Textbook for

Marketing Audit And Performance A Case Of Parastatals Marketin Audit And Performance

Authors: Bonventure Onyango Odote, Wyckliffe Otieno Robby

1st Edition

365946595X, 978-3659465956

More Books

Students also viewed these Accounting questions