Question
Use the table of monthly expenses below for the following questions: 1# What type of chart or graph would you use to visualize a comparison
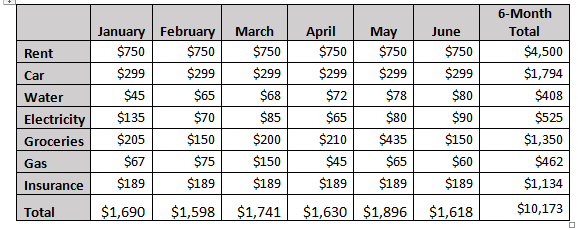
Use the table of monthly expenses below for the following questions:
1# What type of chart or graph would you use to visualize a comparison of each expense in relation to the 6-month total? Why?{Suggestion pie] chart
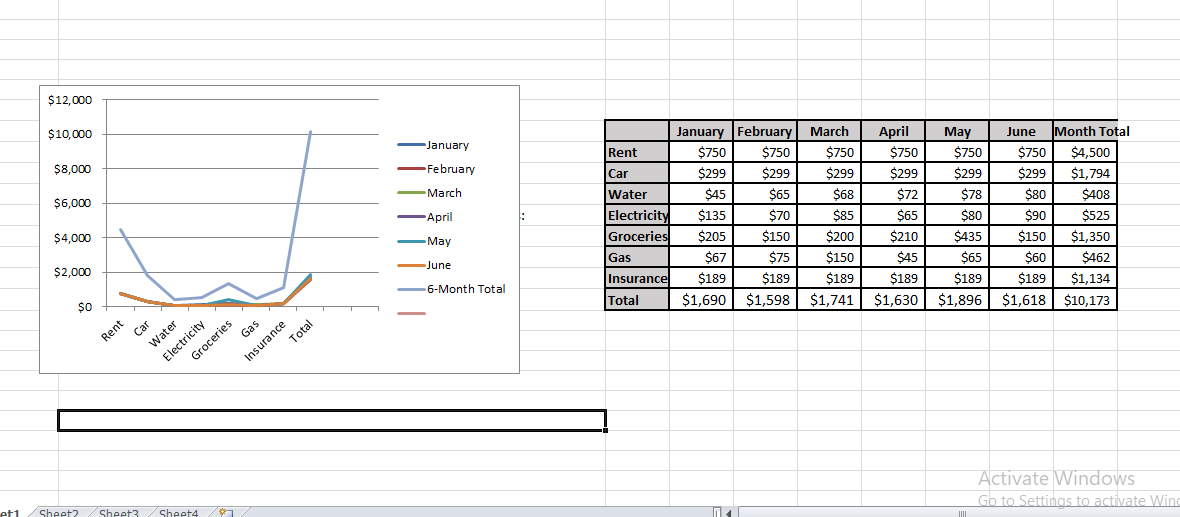
2#Summarize what you can determine about the monthly expenses based on the graph that you created.
3#Some of the expenses remain constant, whereas other expenses vary each month.
What type of chart or graph would you use if you wanted to visualize the monthly trends for the expenses that change each month? Why?
4#Based on the graph that you just created above, which month had an outlier?
What is a logical reason why this month's expenses could have been outside of the normal range?


Step by Step Solution
There are 3 Steps involved in it
Step: 1

Get Instant Access to Expert-Tailored Solutions
See step-by-step solutions with expert insights and AI powered tools for academic success
Step: 2

Step: 3

Ace Your Homework with AI
Get the answers you need in no time with our AI-driven, step-by-step assistance
Get Started


