Answered step by step
Verified Expert Solution
Link Copied!

Question

1 Approved Answer

Use the Table to determine the Mean and Standard Deviation of the probability distribution Number of dogs Probability per household, P(x) 10 0.35 0.25 2
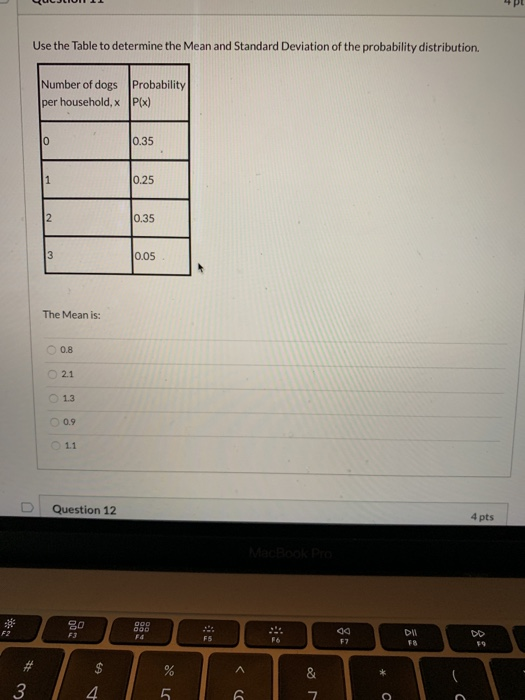
image text in transcribed
Use the Table to determine the Mean and Standard Deviation of the probability distribution Number of dogs Probability per household, P(x) 10 0.35 0.25 2 0.35 3 0.05 The Mean is: 0.8 2.1 1.3 0.9 1.1 Question 12 4 pts F2 80 F3 090 000 FC .: F5 DI FB DD F7 % & 3 4 5 CC 7

Step by Step Solution

There are 3 Steps involved in it

Step: 1

blur-text-image

Get Instant Access to Expert-Tailored Solutions

See step-by-step solutions with expert insights and AI powered tools for academic success

Step: 2

blur-text-image

Step: 3

blur-text-image

Ace Your Homework with AI

Get the answers you need in no time with our AI-driven, step-by-step assistance

Get Started

Recommended Textbook for

Financial Accounting Working Papers Tools For Business Decision Making

Authors: Paul D. Kimmel ,Jerry J. Weygandt ,Donald E. Kieso

6th Edition

0470887931, 978-0470887936

More Books

Students also viewed these Accounting questions