Answered step by step
Verified Expert Solution
Link Copied!

Question

1 Approved Answer

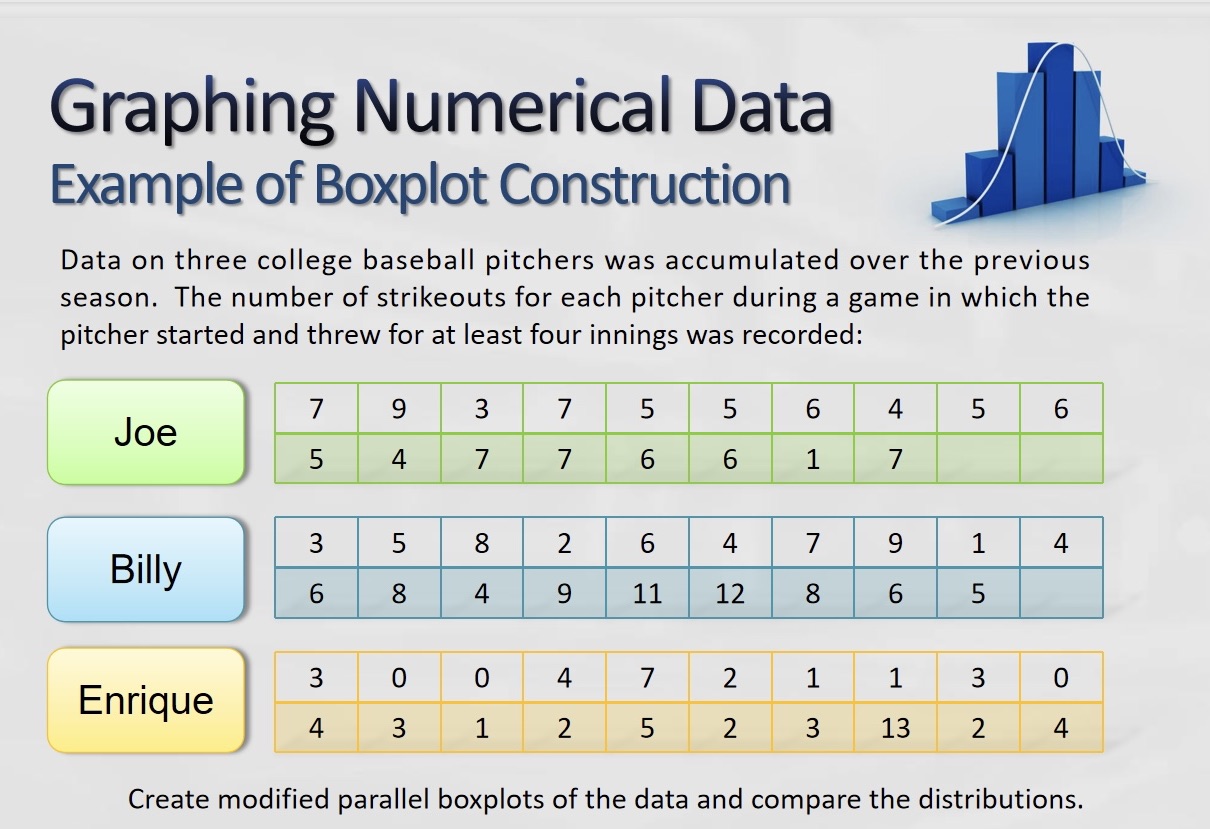
Use the three data sets to draw three vertical box plots, then explain the results. Graphing Numerical Data Example of Boxplot Construction Data on three

Use the three data sets to draw three vertical box plots, then explain the results.

image text in transcribed
Graphing Numerical Data Example of Boxplot Construction Data on three college baseball pitchers was accumulated over the previous season. The number of strikeouts for each pitcher during a game in which the pitcher started and threw for at least four innings was recorded: 7 Joe 9 3 7 5 5 6 4 5 6 5 4 7 7 6 6 7 3 Billy 5 8 2 6 4 7 9 1 4 6 8 4 9 11 12 8 6 5 Enrique 3 0 0 4 7 2 1 1 3 0 4 W 1 2 5 2 3 13 2 4 Create modified parallel boxplots of the data and compare the distributions

Step by Step Solution

There are 3 Steps involved in it

Step: 1

blur-text-image

Get Instant Access to Expert-Tailored Solutions

See step-by-step solutions with expert insights and AI powered tools for academic success

Step: 2

blur-text-image

Step: 3

blur-text-image

Ace Your Homework with AI

Get the answers you need in no time with our AI-driven, step-by-step assistance

Get Started

Recommended Textbook for

More Books

Students also viewed these Mathematics questions

Question

2. List the advantages of listening well

Answered: 1 week ago