Answered step by step
Verified Expert Solution
Question
1 Approved Answer
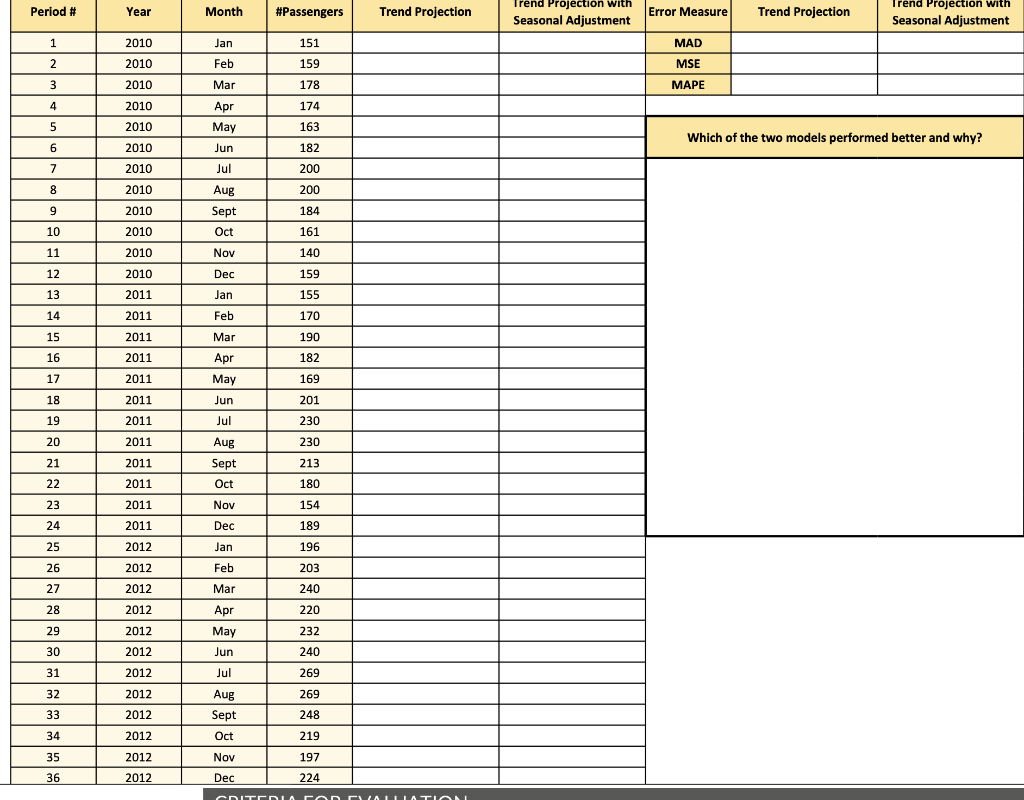
Use the trend projection method, and the trend projection with seasonal adjustment method to create forecasting models in Excel. Next, using the two models, compute
Use the trend projection method, and the trend projection with seasonal adjustment method to create forecasting models in Excel.
Next, using the two models, compute the forecasted values of monthly total passengers between 2010 to 2012
Compare the above two models using MAD, MSE, and MAPE
Please explain which of the two models is performing better and why?

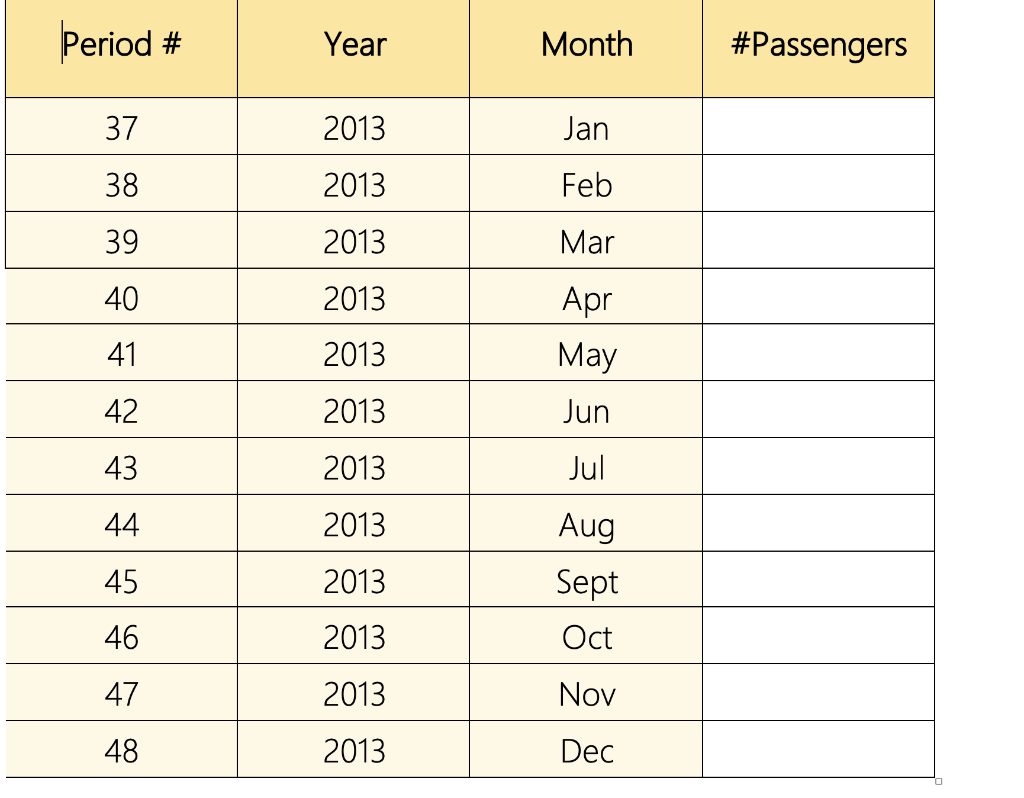
 Use the best model to forecast the monthly total passengers for year 2013
Step by Step Solution
There are 3 Steps involved in it
Step: 1

Get Instant Access to Expert-Tailored Solutions
See step-by-step solutions with expert insights and AI powered tools for academic success
Step: 2

Step: 3

Ace Your Homework with AI
Get the answers you need in no time with our AI-driven, step-by-step assistance
Get Started


