Question
Use the variance-covariance matrix, mean return vector, and sigma vector that you calculated Ford Motors, Goldman Sachs, Starbucks, General Electric, and Macy's Inc., finish the
Use the variance-covariance matrix, mean return vector, and sigma vector that you calculated Ford Motors, Goldman Sachs, Starbucks, General Electric, and Macy's Inc., finish the following questions:
a. Annualize variance-covariance matrix, mean return vector, and sigma vector.
b.Assuming that the risk-free rate is 0%, calculate an envelope portfolio of these six firmswith no short sale restrictions (i.e. with short sales).
c.Assuming that the risk-free rate is 5%, calculate another envelope portfolio of these six firmswith no short sale restrictions (i.e. with short sales).
d.Use the two envelope portfolios that you created in a and b, and generate an envelope frontier of these six companieswith no short sale restrictions (i.e. with short sales). Plot the frontier.
e. Show and plot that six individual stocks all lie within the envelope frontier that you created in c.

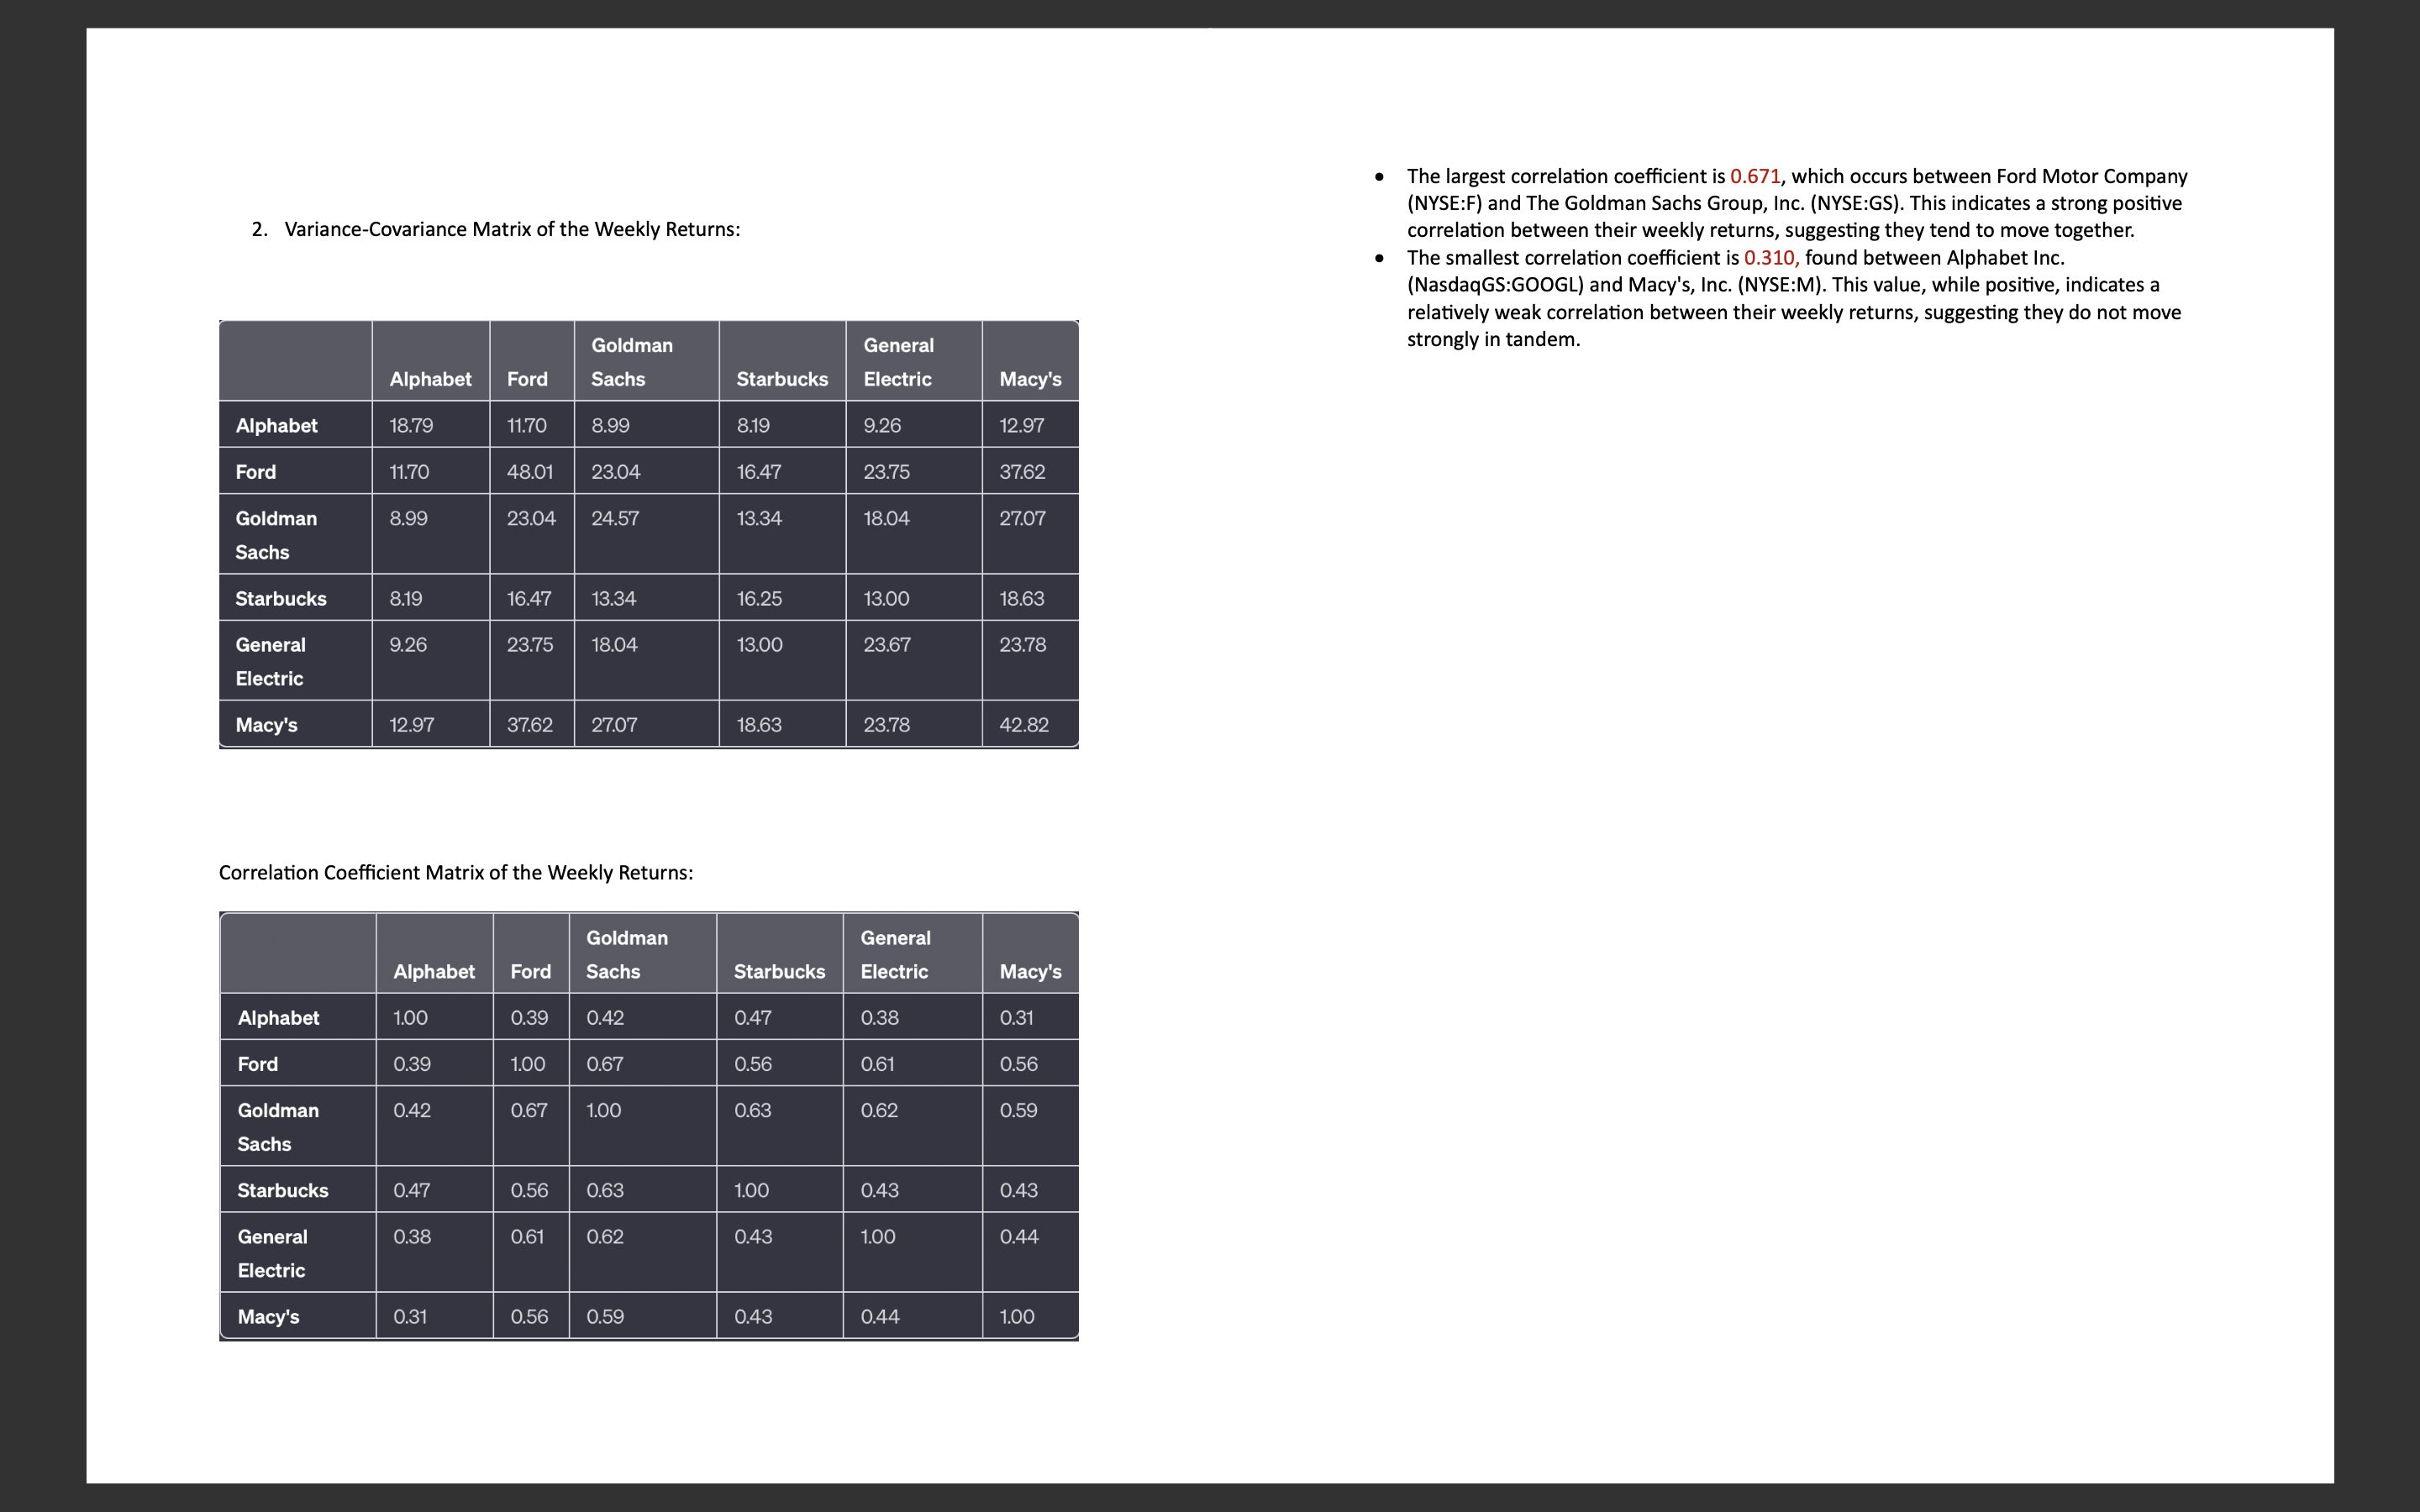
2. Variance-Covariance Matrix of the Weekly Returns: Goldman General Alphabet Ford Sachs Starbucks Electric Macy's Alphabet 18.79 11.70 8.99 8.19 9.26 12.97 Ford 11.70 48.01 23.04 16.47 23.75 37.62 Goldman 8.99 23.04 24.57 13.34 18.04 27.07 Sachs Starbucks 8.19 16.47 13.34 16.25 13.00 18.63 General Electric 9.26 23.75 18.04 13.00 23.67 23.78 Macy's 12.97 37.62 27.07 18.63 23.78 42.82 Correlation Coefficient Matrix of the Weekly Returns: Goldman General Alphabet Ford Sachs Starbucks Electric Macy's Alphabet 1.00 0.39 0.42 0.47 0.38 0.31 Ford 0.39 1.00 0.67 0.56 0.61 0.56 Goldman 0.42 0.67 1.00 0.63 0.62 0.59 Sachs Starbucks 0.47 0.56 0.63 1.00 0.43 0.43 General 0.38 0.61 0.62 0.43 1.00 0.44 Electric Macy's 0.31 0.56 0.59 0.43 0.44 1.00 The largest correlation coefficient is 0.671, which occurs between Ford Motor Company (NYSE:F) and The Goldman Sachs Group, Inc. (NYSE:GS). This indicates a strong positive correlation between their weekly returns, suggesting they tend to move together. The smallest correlation coefficient is 0.310, found between Alphabet Inc. (NasdaqGS:GOOGL) and Macy's, Inc. (NYSE:M). This value, while positive, indicates a relatively weak correlation between their weekly returns, suggesting they do not move strongly in tandem.
Step by Step Solution
There are 3 Steps involved in it
Step: 1

Get Instant Access to Expert-Tailored Solutions
See step-by-step solutions with expert insights and AI powered tools for academic success
Step: 2

Step: 3

Ace Your Homework with AI
Get the answers you need in no time with our AI-driven, step-by-step assistance
Get Started


