

Answered step by step
Verified Expert Solution
Question
1 Approved Answer
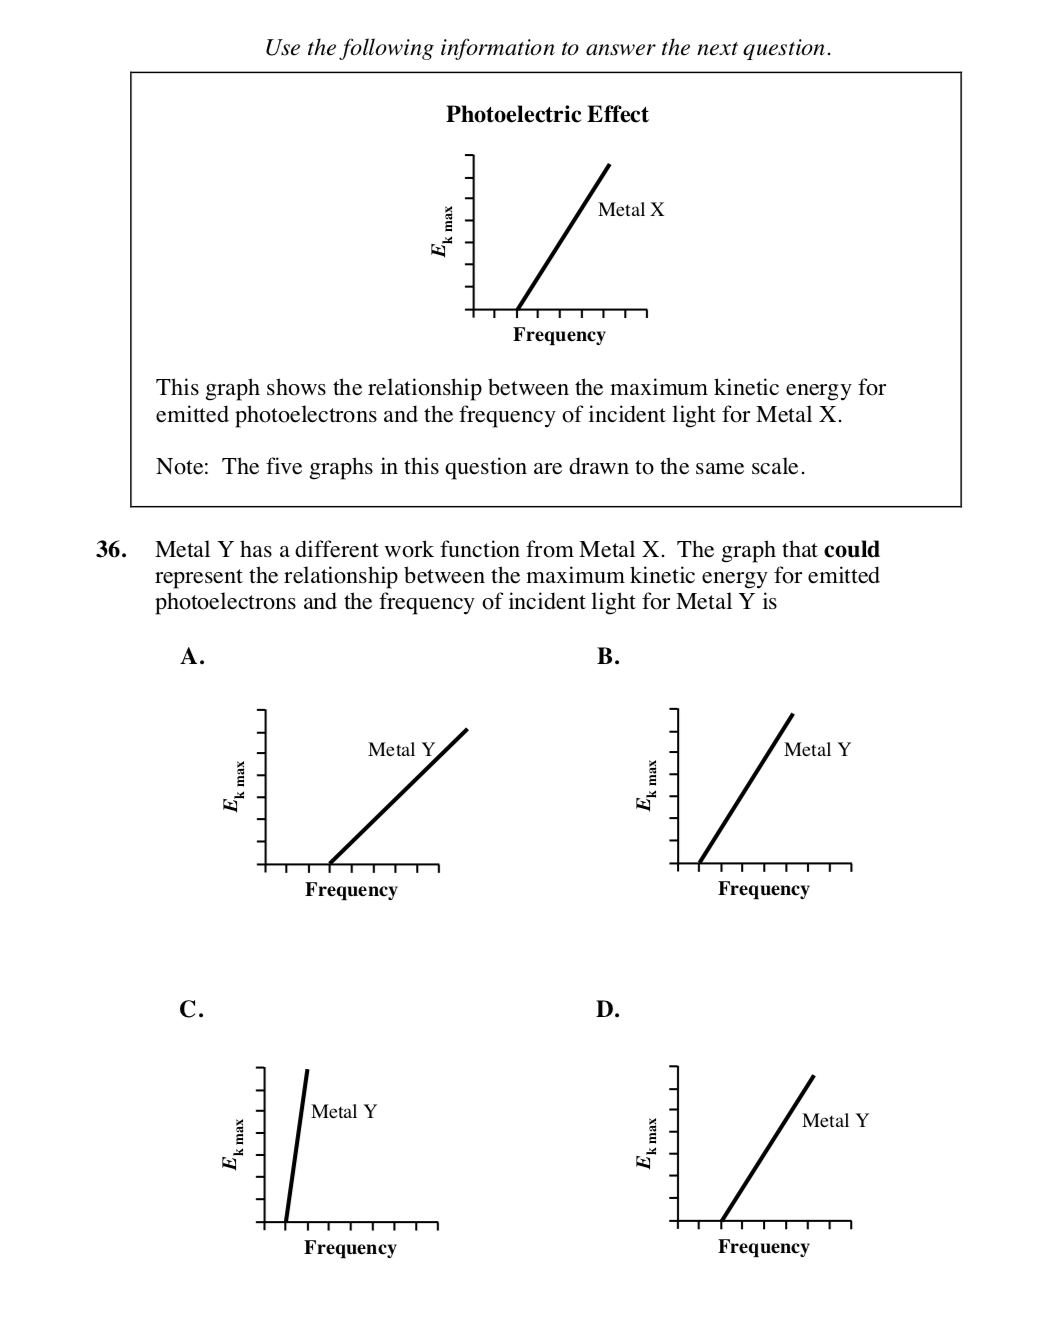
Use thefoiiowing information to answer the next question. Photoelectric Effect Frequency This graph shows the relationship between the maximum kinetic energy for emitted photoelectrons and
Step by Step Solution
There are 3 Steps involved in it
Step: 1

Get Instant Access to Expert-Tailored Solutions
See step-by-step solutions with expert insights and AI powered tools for academic success
Step: 2

Step: 3
Ace Your Homework with AI
Get the answers you need in no time with our AI-driven, step-by-step assistance
Get Started
Fundamentals of Heat and Mass Transfer
Authors: Incropera, Dewitt, Bergman, Lavine
6th Edition
978-0470055540, 471457280, 470881453, 470055545, 978-0470881453, 978-0471457282