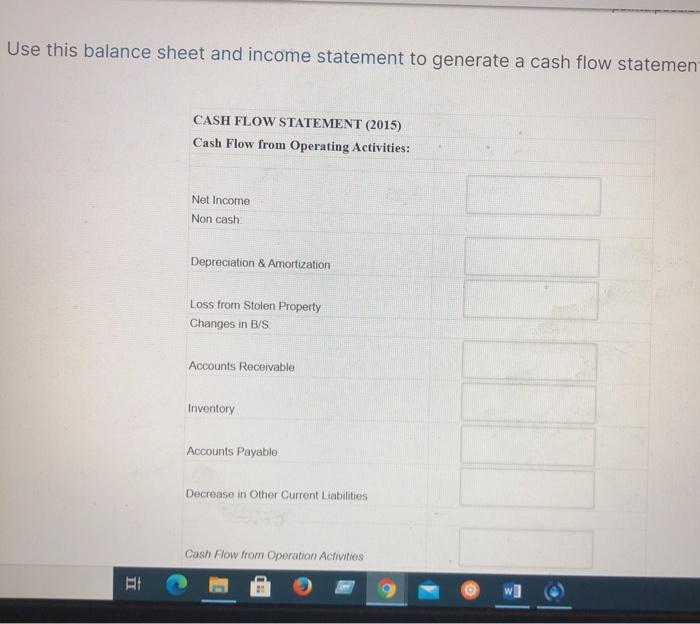
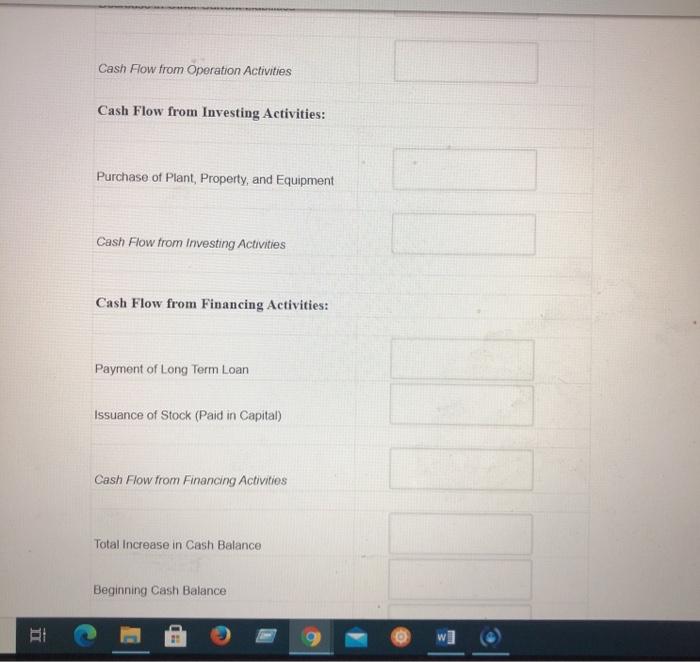
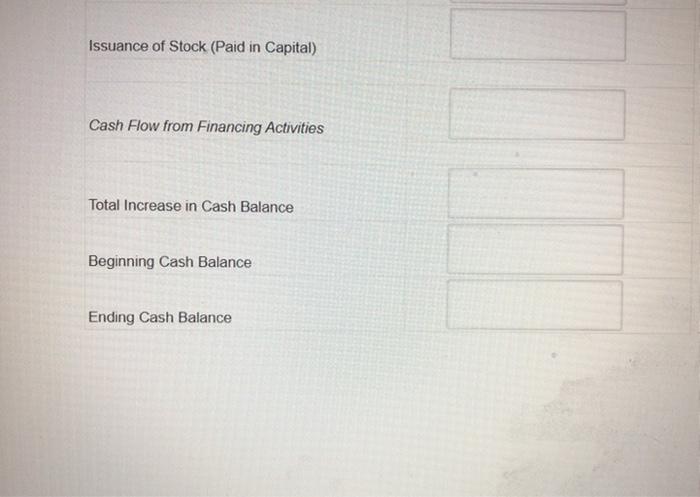
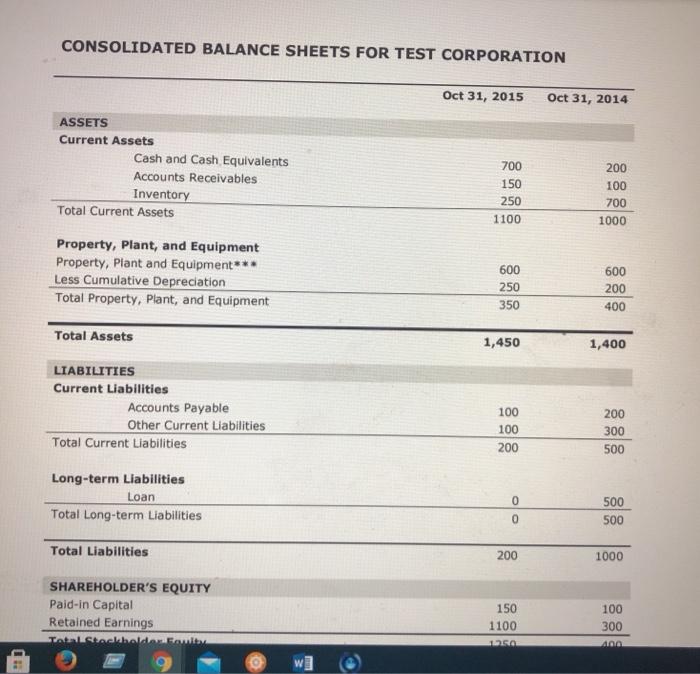
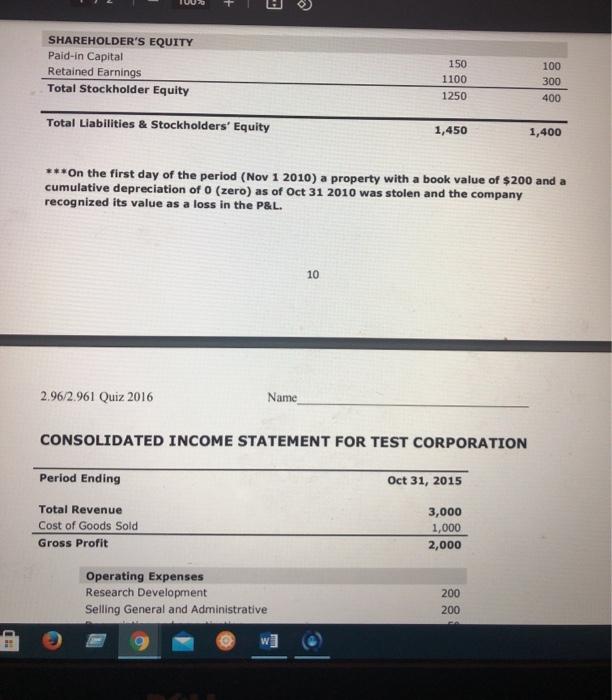
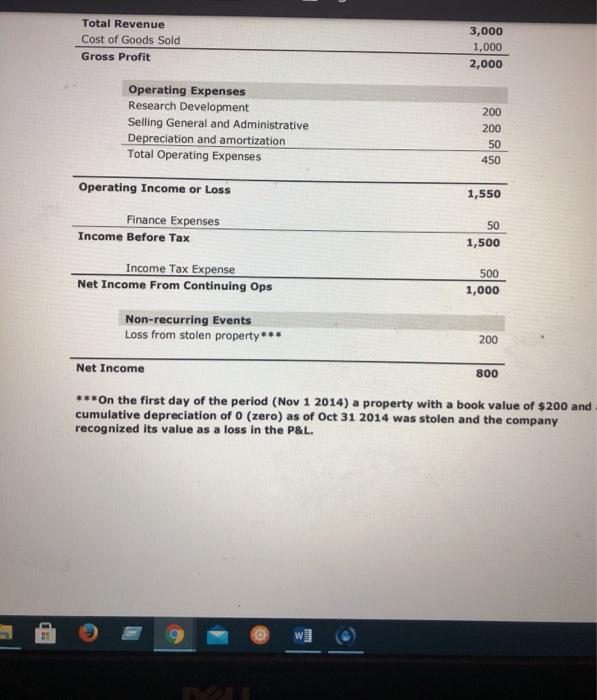
Use this balance sheet and income statement to generate a cash flow statemen CASH FLOW STATEMENT (2015) Cash Flow from Operating Activities: Net Income Non cash Depreciation & Amortization Loss from Stolen Property Changes in B/S Accounts Receivable Inventory Accounts Payable Decrease in Other Current Liabilities Cash Flow from Operation Activities Cash Flow from Operation Activities Cash Flow from Investing Activities: Purchase of Plant, Property, and Equipment Cash Flow from Investing Activities Cash Flow from Financing Activities: Payment of Long Term Loan Issuance of Stock (Paid in Capital) Cash Flow from Financing Activities Total increase in Cash Balance Beginning Cash Balance w] Issuance of Stock (Paid in Capital) Cash Flow from Financing Activities Total Increase in Cash Balance Beginning Cash Balance Ending Cash Balance CONSOLIDATED BALANCE SHEETS FOR TEST CORPORATION Oct 31, 2015 Oct 31, 2014 ASSETS Current Assets Cash and Cash Equivalents Accounts Receivables Inventory Total Current Assets 700 150 250 1100 200 100 700 1000 Property, Plant, and Equipment Property, Plant and Equipment*** Less Cumulative Depreciation Total Property, Plant, and Equipment 600 250 350 600 200 400 Total Assets 1,450 1,400 LIABILITIES Current Liabilities Accounts Payable Other Current Liabilities Total Current Liabilities 200 100 100 200 300 500 Long-term Liabilities Loan Total Long-term Liabilities 0 0 500 500 Total Liabilities 200 1000 SHAREHOLDER'S EQUITY Paid-in Capital Retained Earnings Talhaalholder Family 150 1100 LR 100 300 400 SHAREHOLDER'S EQUITY Paid-in Capital Retained Earnings Total Stockholder Equity 150 1100 1250 100 300 400 Total Liabilities & Stockholders' Equity 1,450 1,400 ***On the first day of the period (Nov 1 2010) a property with a book value of $200 and a cumulative depreciation of 0 (zero) as of Oct 31 2010 was stolen and the company recognized its value as a loss in the P&L. 10 2.96/2.961 Quiz 2016 Name CONSOLIDATED INCOME STATEMENT FOR TEST CORPORATION Perlod Ending Oct 31, 2015 Total Revenue Cost of Goods Sold Gross Profit 3,000 1,000 2,000 Operating Expenses Research Development Selling General and Administrative 200 200 Total Revenue Cost of Goods Sold Gross Profit 3,000 1,000 2,000 Operating Expenses Research Development Selling General and Administrative Depreciation and amortization Total Operating Expenses 200 200 50 450 Operating Income or Loss 1,550 Finance Expenses Income Before Tax 50 1,500 Income Tax Expense Net Income From Continuing Ops 500 1,000 Non-recurring Events Loss from stolen property*** 200 Net Income 800 ***On the first day of the period (Nov 1 2014) a property with a book value of $200 and cumulative depreciation of 0 (zero) as of Oct 31 2014 was stolen and the company recognized its value as a loss in the P&L. w]
