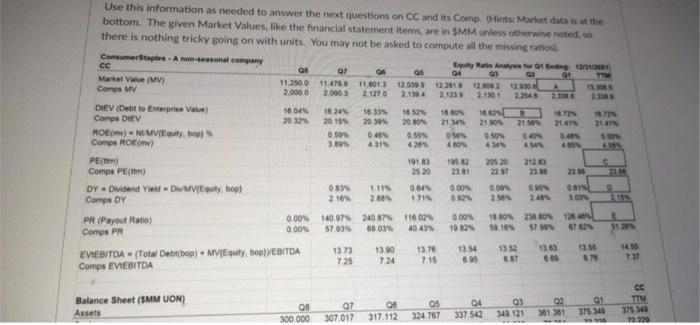
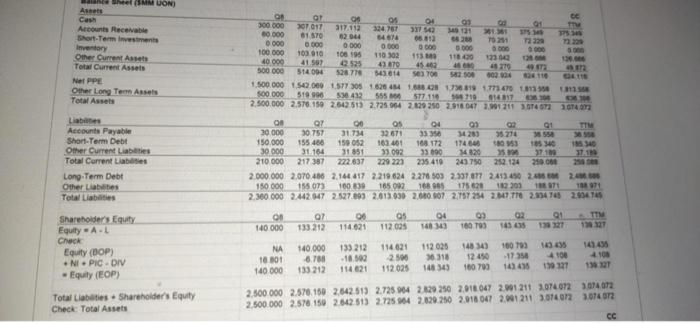
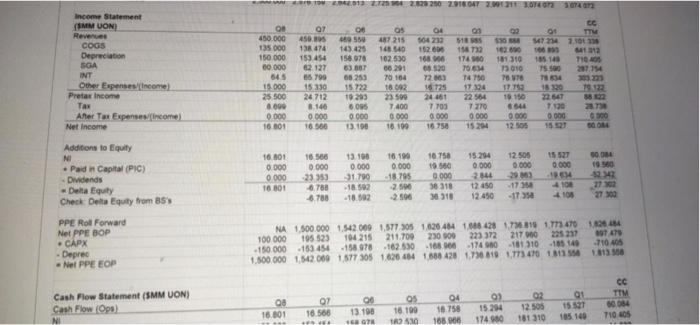
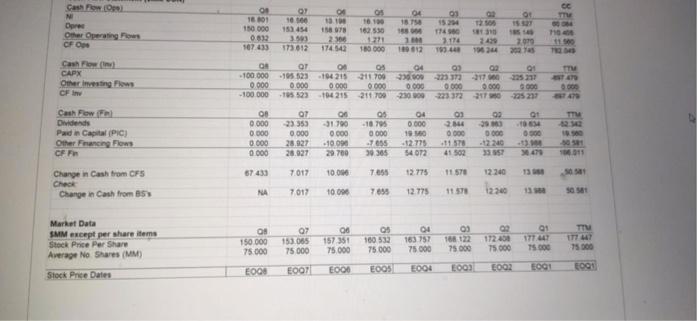
Use this information as needed to answer the next questions on CC and its Comp. Hints Market data is the bottom. The given Market Values, like the financial statement items are in SMM unless otherwise noted. so there is nothing tricky going on with units. You may not be asked to compute all the missing ratios Consumer Staples - A non-seasonal company Q5 Reis Ansong OT 04 03 Marta V (MV) 90 112500 11.4718 11.013 12.00 12.2018 Comps MV 12.0093 20 2.0000 2.1770 2.1984 2.1333 DEV (Debit to Enterprise Vale) 16 IN 1824 1633 180 Comps DEV 20 2015 2003 20 0 2134 21 21 ROEM - N/MV/Equity, bool 50 0.4 0. SON OS Comps ROE() 30 4315 4 PE/ 101 205 20 212.00 Compe PE() 25 20 23.01 DY Dividend Dwuty, bop) 089 1119 06 000 Go GN 9 Comps DY 2109 28 1714 002 2. PR (Payout Ratio) 0.00 140 675 240 8711160 0.00N 1860 2012 GOON Comps PR 57.99% 6503 40 435 10125 50 10% ST 512 13.73 13.7 13.00 EVIEBITDA - (Total Debt bop). MEquity, bop)EBITDA 13.54 136 7.25 724 7.15 6.95 6.87 711 Comps EVIEBITDA Balance Sheet (SMM UON) Assets 08 300 000 07 307.017 05 324 767 06 317.112 04 337 543 CC TTM 375 340 03 349.121 02 301 301 01 375 340 el (SMM UON Arts Cash Accounts Receivable Short-Term investments 4613 Other Current Assets Tot Current Assets Ner PPE Other Long Term Asses Total Assets Labas Accounts Payable Short-Term Debt Other Current Liabilities Total Current Labs Long-Term Debt Other Labs Total Liabetes OP 08 BE OS 04 300.000 307 017 90 317.112 324.77 371 542 120 60 000 81 570 62044 54678 0 000 0 000 0.000 TO 2 0 000 0000 100 000 103 10 106198 110302 113 40 000 11640 30 43670 45.462 500 000 514094 45 270 526776 543.614 ses 100 52 500 902.004 1.500.000 542.000 1.577 305 162643410428 56 819 70 500.000 519.990 530432 555 577.110 2.500.000 2.570.159 2642 51) 2.725 064 2629 250 216047 2.91 211 3747 1614 On Oy 00 os 04 3 190 30 000 30 757 31 734 33.95 34259 95 274 3550 150.000 155486 159 052 163401 169. 172 174646 53 30.000 31.164 31851 33092 33.000 14820 3 37100 210 000 217 387 222 637 229 223 235410 249 50 252134 2.000.000 2.070.406 2.144 817 2.219 624 2.278 503 2.337 377 2413.45 2.0 2.0 150 000 155.073 100.8:39 185092168985 175620 162 203 1971 2.360.000 2442047 2.527.803 2.013.030 2.080 907 2.75 254 2,17778 2.954 T5 2.95414 on 07 00 05 04 09 1 133 212 114 621 140 000 112005 148143 160793 1435 17012 NA 140.000 133 212 114 621 112025 148 149 100T 16.01 6. -18.00 2.500 36.310 12450 17 318 4 104 114021 140 000 112025 148 343 143438 1312 133212 160703 179 127 Shareholders Equity Equity - A. Check Equity (OOP) NI PIC-DIV - Equity (EOP) Total Liabetes. Shareholder's Equity Check: Total Assets 2.500.000 2.576.160 2642 513 2.725 904 2.120.250 2.018047 2.901211 1.074072 374072 2.500.000 2.578 150 2642.51) 2.725 04 220.250 2.018 047 2001 211 3.0140723074 072 CC 12 22.623200291807 2.8171 2014073074 EC Income Statement MM VON Revenue COGS Deprecation SGA INT Other Expenses (Income Pretax income Tax After Tax Expenses (income) Net Income 450.000 135 000 150 000 00.000 545 15.000 25 500 8.000 0.000 16 001 Q7 450.05 13 474 153454 2127 35790 15330 24 712 8.140 0 000 16.566 06 550 43.425 156970 63 887 68.253 15.722 10203 6.00 0.000 13.190 ot 564212 152604 168 68.520 72.00 487215 148.140 102.530 66 291 70.164 18.092 23590 7400 0 000 18.100 547 234 7101 12 1312 181 310 105.14 THAN 15010 207.154 76 TE m 17 1912 10 150 6644 720 23 000 0 000 12.05 1547 1740 7064 T4750 11 124 22 584 7770 0 000 2448 7 703 0 000 16750 50.084 12.500 0.000 0.000 Additions to Equity NI Padin Capital (PC) Dividends Delta Equity Check Delta Equity from 85 16.801 0.000 0.000 16 01 16 566 0 000 23953 6780 -6.780 13.100 0.000 -31790 -18592 -18.592 10.12 0.000 -18.795 2500 -2500 16750 19.50 0 000 36 318 5318 1234 0.000 24 2450 12.450 -17.30 -1735 27300 PPE Roll Forward Net PPE BOP Deprec Nel PPE EOP NA 1.500.000 1.542.000 1.577 305 1626.484 1048428 1,781 1.773 47026484 100 000 195523 104 215 211.709 25000 223372 21700 1974 - 150000153 454158978 162.550 - 1680-1749-181510 -185 149 -710 AS 1.500.000 1.542.000 1577 305 1620 44 1660 420 17368101.77347011311356 Cash Flow Statement (SMM UON) Cash Flow (Ops) NI Q 16.801 07 16 588 OS 16.190 10 13.190 BOTH 04 16.758 1886 03 15294 1749 15527 CC TIM 50084 T1005 02 12.505 181310 os 16100 03 Cashow.com N Opred Other Operating OS OS 1601 150 000 0812 107 433 506 Oy 10.00 153454 3.59 573012 04 13.10 15878 23 174543 04 15.15 100 no CFO 1749 7.114 1934 2010 180 000 10012 1964 Cash Flow CAPX Other investing CF .100.000 0.000 -100 000 OT 105523-194215 0.000 0 000 104 215 OS 04 09 02 21 211709930022-31022517 0 000 0 000 0 000 000 009 211700 230909223372 3170225211 000 OT 01 TTM Cash Flow Dividends Padin Capital (PC) Other Financing Flows CF F 00 0000 0.000 0 000 0.000 00 -31790 0 000 -10090 29.700 24 0 000 99 20 000 0.000 28.927 28.927 0.500 -10795 0 000 7655 30 301 0.000 1960 -12.775 54072 50 41 502 335 473 7017 10.000 7655 12.775 Change in Cash from CFS Check Change in Cash from 85 NA 7017 1009 7655 12.775 12.30 TV Market Data SMM except per share items Stock Price Per Share Average No Shares (MM) Os 150 000 75 000 07 153.055 75 000 00 157351 75.000 160 532 75 000 04 163 757 75 000 03 168122 75.000 172.400 75.000 01 171647 75.000 EDOT E000 EDO EOOS ECOH E00) E0Q2 EOGI Stock Price Dates FOQI 1088 23 19 What is the value of A? Round your answer to zero decimal places 19 D 24 What is the value of D? Use this information as needed to answer the next questions on CC and its Comp. Hints Market data is the bottom. The given Market Values, like the financial statement items are in SMM unless otherwise noted. so there is nothing tricky going on with units. You may not be asked to compute all the missing ratios Consumer Staples - A non-seasonal company Q5 Reis Ansong OT 04 03 Marta V (MV) 90 112500 11.4718 11.013 12.00 12.2018 Comps MV 12.0093 20 2.0000 2.1770 2.1984 2.1333 DEV (Debit to Enterprise Vale) 16 IN 1824 1633 180 Comps DEV 20 2015 2003 20 0 2134 21 21 ROEM - N/MV/Equity, bool 50 0.4 0. SON OS Comps ROE() 30 4315 4 PE/ 101 205 20 212.00 Compe PE() 25 20 23.01 DY Dividend Dwuty, bop) 089 1119 06 000 Go GN 9 Comps DY 2109 28 1714 002 2. PR (Payout Ratio) 0.00 140 675 240 8711160 0.00N 1860 2012 GOON Comps PR 57.99% 6503 40 435 10125 50 10% ST 512 13.73 13.7 13.00 EVIEBITDA - (Total Debt bop). MEquity, bop)EBITDA 13.54 136 7.25 724 7.15 6.95 6.87 711 Comps EVIEBITDA Balance Sheet (SMM UON) Assets 08 300 000 07 307.017 05 324 767 06 317.112 04 337 543 CC TTM 375 340 03 349.121 02 301 301 01 375 340 el (SMM UON Arts Cash Accounts Receivable Short-Term investments 4613 Other Current Assets Tot Current Assets Ner PPE Other Long Term Asses Total Assets Labas Accounts Payable Short-Term Debt Other Current Liabilities Total Current Labs Long-Term Debt Other Labs Total Liabetes OP 08 BE OS 04 300.000 307 017 90 317.112 324.77 371 542 120 60 000 81 570 62044 54678 0 000 0 000 0.000 TO 2 0 000 0000 100 000 103 10 106198 110302 113 40 000 11640 30 43670 45.462 500 000 514094 45 270 526776 543.614 ses 100 52 500 902.004 1.500.000 542.000 1.577 305 162643410428 56 819 70 500.000 519.990 530432 555 577.110 2.500.000 2.570.159 2642 51) 2.725 064 2629 250 216047 2.91 211 3747 1614 On Oy 00 os 04 3 190 30 000 30 757 31 734 33.95 34259 95 274 3550 150.000 155486 159 052 163401 169. 172 174646 53 30.000 31.164 31851 33092 33.000 14820 3 37100 210 000 217 387 222 637 229 223 235410 249 50 252134 2.000.000 2.070.406 2.144 817 2.219 624 2.278 503 2.337 377 2413.45 2.0 2.0 150 000 155.073 100.8:39 185092168985 175620 162 203 1971 2.360.000 2442047 2.527.803 2.013.030 2.080 907 2.75 254 2,17778 2.954 T5 2.95414 on 07 00 05 04 09 1 133 212 114 621 140 000 112005 148143 160793 1435 17012 NA 140.000 133 212 114 621 112025 148 149 100T 16.01 6. -18.00 2.500 36.310 12450 17 318 4 104 114021 140 000 112025 148 343 143438 1312 133212 160703 179 127 Shareholders Equity Equity - A. Check Equity (OOP) NI PIC-DIV - Equity (EOP) Total Liabetes. Shareholder's Equity Check: Total Assets 2.500.000 2.576.160 2642 513 2.725 904 2.120.250 2.018047 2.901211 1.074072 374072 2.500.000 2.578 150 2642.51) 2.725 04 220.250 2.018 047 2001 211 3.0140723074 072 CC 12 22.623200291807 2.8171 2014073074 EC Income Statement MM VON Revenue COGS Deprecation SGA INT Other Expenses (Income Pretax income Tax After Tax Expenses (income) Net Income 450.000 135 000 150 000 00.000 545 15.000 25 500 8.000 0.000 16 001 Q7 450.05 13 474 153454 2127 35790 15330 24 712 8.140 0 000 16.566 06 550 43.425 156970 63 887 68.253 15.722 10203 6.00 0.000 13.190 ot 564212 152604 168 68.520 72.00 487215 148.140 102.530 66 291 70.164 18.092 23590 7400 0 000 18.100 547 234 7101 12 1312 181 310 105.14 THAN 15010 207.154 76 TE m 17 1912 10 150 6644 720 23 000 0 000 12.05 1547 1740 7064 T4750 11 124 22 584 7770 0 000 2448 7 703 0 000 16750 50.084 12.500 0.000 0.000 Additions to Equity NI Padin Capital (PC) Dividends Delta Equity Check Delta Equity from 85 16.801 0.000 0.000 16 01 16 566 0 000 23953 6780 -6.780 13.100 0.000 -31790 -18592 -18.592 10.12 0.000 -18.795 2500 -2500 16750 19.50 0 000 36 318 5318 1234 0.000 24 2450 12.450 -17.30 -1735 27300 PPE Roll Forward Net PPE BOP Deprec Nel PPE EOP NA 1.500.000 1.542.000 1.577 305 1626.484 1048428 1,781 1.773 47026484 100 000 195523 104 215 211.709 25000 223372 21700 1974 - 150000153 454158978 162.550 - 1680-1749-181510 -185 149 -710 AS 1.500.000 1.542.000 1577 305 1620 44 1660 420 17368101.77347011311356 Cash Flow Statement (SMM UON) Cash Flow (Ops) NI Q 16.801 07 16 588 OS 16.190 10 13.190 BOTH 04 16.758 1886 03 15294 1749 15527 CC TIM 50084 T1005 02 12.505 181310 os 16100 03 Cashow.com N Opred Other Operating OS OS 1601 150 000 0812 107 433 506 Oy 10.00 153454 3.59 573012 04 13.10 15878 23 174543 04 15.15 100 no CFO 1749 7.114 1934 2010 180 000 10012 1964 Cash Flow CAPX Other investing CF .100.000 0.000 -100 000 OT 105523-194215 0.000 0 000 104 215 OS 04 09 02 21 211709930022-31022517 0 000 0 000 0 000 000 009 211700 230909223372 3170225211 000 OT 01 TTM Cash Flow Dividends Padin Capital (PC) Other Financing Flows CF F 00 0000 0.000 0 000 0.000 00 -31790 0 000 -10090 29.700 24 0 000 99 20 000 0.000 28.927 28.927 0.500 -10795 0 000 7655 30 301 0.000 1960 -12.775 54072 50 41 502 335 473 7017 10.000 7655 12.775 Change in Cash from CFS Check Change in Cash from 85 NA 7017 1009 7655 12.775 12.30 TV Market Data SMM except per share items Stock Price Per Share Average No Shares (MM) Os 150 000 75 000 07 153.055 75 000 00 157351 75.000 160 532 75 000 04 163 757 75 000 03 168122 75.000 172.400 75.000 01 171647 75.000 EDOT E000 EDO EOOS ECOH E00) E0Q2 EOGI Stock Price Dates FOQI 1088 23 19 What is the value of A? Round your answer to zero decimal places 19 D 24 What is the value of D
