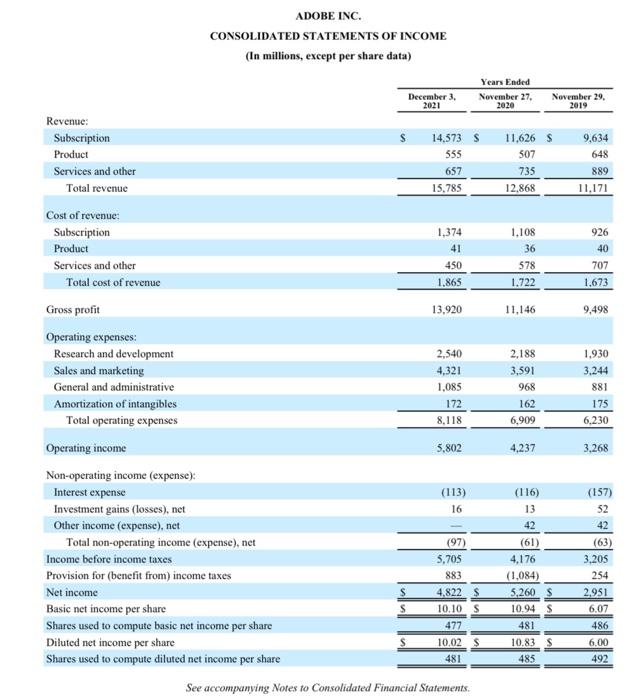
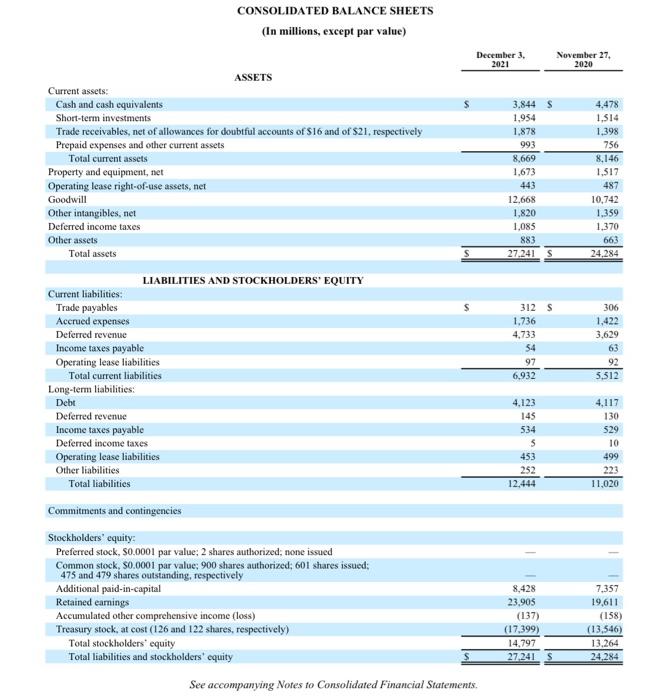
Use this sheet to calculate Cash Conversion Cycle (CCC) for the last two years. Insert comments in a text box. Do they have information on Day sales outstanding, Days of inventory outstanding and Days of payables outstanding
Complete this in EXCEL.
this is a link to the company's form 10-K https://www.annualreports.com/HostedData/AnnualReports/PDF/NASDAQ_ADBE_2021.pdf
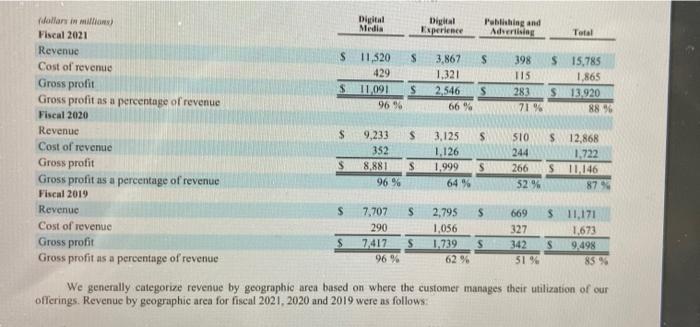
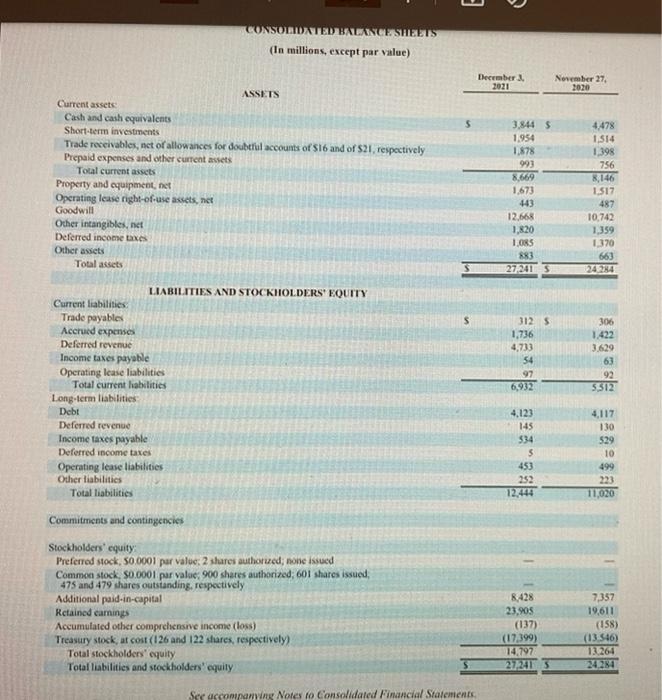
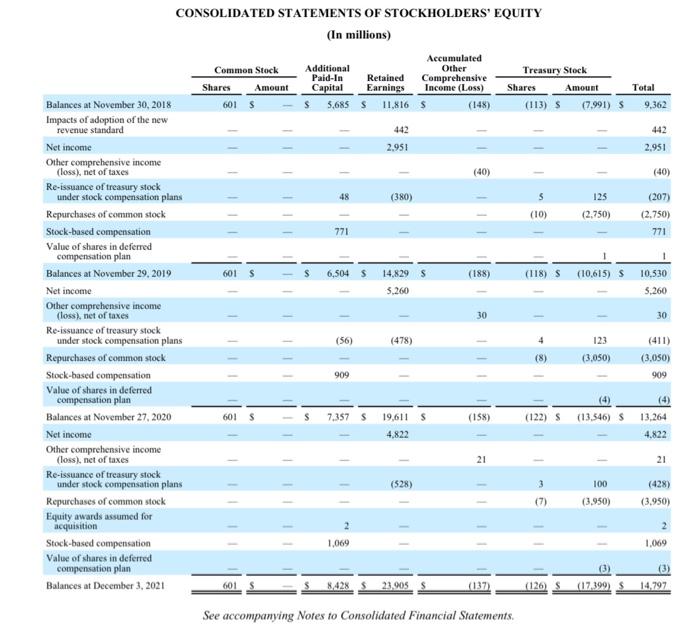
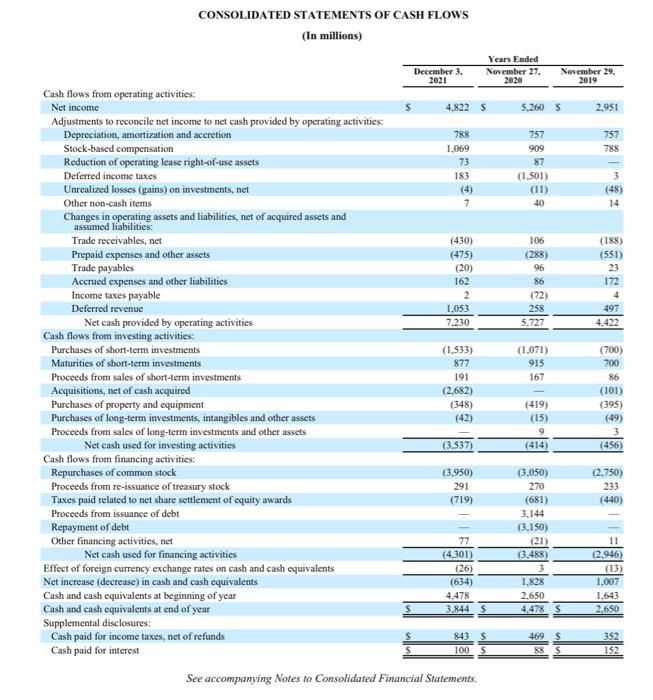
Digital Media Digital Experience Publishing and Advertising Total S S 11,320 429 11 091 96 96 $ 3,867 1,321 2,546 66% 398 T15 283 71% S S 15,785 1.865 13.920 88 % S $ Mollar in millions) Fiscal 2021 Revenue Cost of revenue Gross profit Gross profit as a percentage of revenue Fiscal 2020 Revenue Cost of revenue Gross profit Gross profit as a percentage of revenue Fiscal 2019 Revenue Cost of revenue Gross profit Gross profit as a percentage of revenue S S 510 244 9,233 352 8,881 96 % 3.125 1.126 1.999 64% $ s S 12,868 1,722 S 11,146 87% S 266 52% S S S 7,707 S 290 7.417 s 96 % 2,795 1,056 1.739 62 % 669 327 342 51% 11,171 1,673 9,498 85 % S We generally categorize revenue by geographic area based on where the customer manages their utilization of our offerings. Revenue by geographic aren for fiscal 2021, 2020 and 2019 were as follows: 3 CONSOLIDATED BALANCE SHEETS (In millions, except par value) December 2021 November 27, 2020 3.844 $ 1.954 1.878 993 ASSETS Current assets Cash and cash equivalents Short-term investments Trade receivables, net of allowances for doubtful accounts of S16 and of 21, respectively Prepaid expenses and other current assets Total current assets Property and equipment, net Operating lease right-of-use assets, net Goodwill Other intangibles, net Deferred income taxes Other assets Total assets 1.673 443 12.668 1,820 1.0RS 883 272415 4.478 1.514 1398 756 8,146 1.517 487 10,742 1.359 370 663 127424 s 312 5 1.736 4,713 54 97 6,932 LIABILITIES AND STOCKHOLDERS' EQUITY Current liabilities Trade payables Accrued expenses Deferred revenue Income taxes payable Operating lease liabilities Total current habilities Long-term liabilities Debt Deferred revenue Income taxes payable Deferred income taxes Operating lease liabilities Other liabilities Total liabilities 306 1.422 3.629 63 92 5.312 4,123 145 $34 $ 453 252 12.444 4,117 130 529 10 499 223 11,020 Commitments and contingencies Stockholders' equity Preferred stock, 50.0001 par value: 2 shares authored, none issued Common stock, 30.0001 par value: 900 shares authorized, 601 shares issued, 475 and 479 shares outstanding, respectively Additional paid-in-capital Retained earnings Accumulated other comprehensive income (loss) Treasury stock, at cost (126 and 122 shares, respectively Total stockholders' equity Total liabilities and stockholders' equily 8,428 23,905 (137) (17.399) 14.797 272413 7,357 19,611 (158) (13.546) 13260 24284 See accompanying Notes to Consolidated Financial Statements CONSOLIDATED STATEMENTS OF STOCKHOLDERS' EQUITY (In millions) Common Stock Shares Amount 601$ Accumulated Additional Other Paid-In Retained Comprehensive Capital Earnings Income (Loss) 5,665 $ 11,816 $ (148) Treasury Stock Shares Amount (113) $ 7,991) S Total 9,362 442 442 2.951 11 2.951 (40) -- (40) 1 48 (380) 125 5 (10) (2.750) (207) (2.750) 771 771 601 6,504 5 (188) (118) S 14,829 $ 5.260 (10.615) S 10.530 5,260 30 30 Balances at November 30, 2018 Impacts of adoption of the new revenue standard Net income Other comprehensive income (loss), net of taxes Re-issuance of treasury stock under stock compensation plans Repurchases of common stock Stock-based compensation Value of shares in deferred compensation plan Balances at November 29, 2019 Net income Other comprehensive income (loss), net of taxes Re-issuance of treasury stock under stock compensation plans Repurchases of common stock Stock-based compensation Value of shares in deferred compensation plan Balances at November 27, 2020 Net income Other comprehensive income (loss), net of taxes Re-issuance of treasury stock under stock compensation plans Repurchases of common stock Equity awards assumed for acquisition Stock-based compensation Value of shares in deferred compensation plan Balances at December 3, 2021 (56) (478) 4 123 (8) (3,050) (411) (3.050) 909 909 601S 7.357 S 19,611 S (158) (122) S (13,546) S 13.264 4,822 4.822 21 21 (528) 3 100 (3,950) (428) (3.950) (7) 2 1,069 1.069 (3) 601 8,428 23.005 (137 (126) S (17.399) 14,797 See accompanying Notes to Consolidated Financial Statements. CONSOLIDATED STATEMENTS OF CASH FLOWS (In millions) December 3. 2021 Years Ended November 27. 2020 November 29, 2019 4,822 S 5,260 $ 2.951 757 788 788 1.069 73 183 (4) 7 757 909 87 (1.501) (11) 40 3 (48) 14 (430) (475) (20) 162 2 1.053 7.230 106 (288) 96 86 (72) 258 5.727 (188) (551) 23 172 4 497 4.422 Cash flows from operating activities: Net income Adjustments to reconcile net income to net cash provided by operating activities Depreciation, amortization and accretion Stock-based compensation Reduction of operating lease right-of-use assets Deferred income taxes Unrealized losses (gains) on investments, net Other non-cash items Changes in operating assets and liabilities, net of acquired assets and assumed liabilities: Trade receivables, net Prepaid expenses and other assets Trade payables Accrued expenses and other liabilities Income taxes payable Deferred revenue Net cash provided by operating activities Cash flows from investing activities: Purchases of short-term investments Maturities of short-term investments Proceeds from sales of short-term investments Acquisitions, net of cash acquired Purchases of property and equipment Purchases of long-term investments, intangibles and other assets Proceeds from sales of long-term investments and other assets Net cash used for investing activities Cash flows from financing activities: Repurchases of common stock Proceeds from re-issuance of treasury stock Taxes paid related to net share settlement of equity awards Proceeds from issuance of debt Repayment of debt Other financing activities, net Net cash used for financing activities Effect of foreign currency exchange rates on cash and cash equivalents Net increase (decrease) in cash and cash equivalents Cash and cash equivalents at beginning of year Cash and cash equivalents at end of year Supplemental disclosures: Cash paid for income taxes, net of refunds Cash paid for interest (1,533) 877 191 (2,682) (348) (1,071) 915 167 (700) 700 86 (101) (395) (49) 3 (456) (42) (419) (15) 9 (414 (3.537) (3,950) 291 (719) (2,750) 233 (440) 77 (4,301) (26) (634) 4.478 3,844 S (3.050) 270 (681) 3.144 (3.150) (21) (3.488) 3 1.828 2.650 4.478 S 11 (2.946) (13) 1.007 1.643 2,650 s 352 843 $ 100 469 s 88 S 152 See accompanying Notes to Consolidated Financial Statements. ADOBE INC. CONSOLIDATED STATEMENTS OF INCOME (In millions, except per share data) Years Ended December 3, November 27, November 29, 2021 2020 2019 Revenue Subscription 14,573 S 11.626 9,634 Product 555 507 648 Services and other 657 735 889 Total revenue 15.785 12.868 11,171 Cost of revenue Subscription 1,374 1.108 926 Product 41 36 40 Services and other 450 578 707 Total cost of revenue 1.865 1.722 1.673 Gross profit 13,920 11,146 9,498 Operating expenses Research and development 2.540 2.188 1.930 Sales and marketing 4,321 3,591 3.244 General and administrative 1,085 968 881 Amortization of intangibles 172 162 175 Total operating expenses 8.118 6,909 6,230 Operating income 5.802 3,268 Non-operating income (expense): Interest expense (113) (116) (157) Investment gains (losses), net 16 13 52 Other income (expense), net 42 42 Total non-operating income (expense), net (97) (61) (63) Income before income taxes 5,705 4,176 3.205 Provision for (benefit from) income taxes 883 (1,084) 254 Net income 4,822 5,260 $ 2,951 Basic net income per share s 10.10 S 10.94 $ 6.07 Shares used to compute basic net income per share 477 481 486 Diluted net income per share 10.02 $ 10.83 S 6.00 Shares used to compute diluted net income per share 481 485 492 See accompanying Notes to Consolidated Financial Statements. 4,237 CONSOLIDATED BALANCE SHEETS (In millions, except par value) December 3. 2021 November 27, 2020 3.844 s 1,954 1,878 993 8,669 1.673 443 12,668 1,820 1,085 883 27.241 S 4,478 1.514 1.398 756 8,146 1.517 487 10,742 1.359 1,370 663 24,284 S ASSETS Current assets: Cash and cash equivalents Short-term investments Trade receivables, net of allowances for doubtful accounts of S16 and of S21, respectively Prepaid expenses and other current assets Total current assets Property and equipment, net Operating lease right-of-use assets, net Goodwill Other intangibles, net Deferred income taxes Other assets Total assets LIABILITIES AND STOCKHOLDERS' EQUITY Current liabilities: Trade payables Accrued expenses Deferred revenue Income taxes payable Operating lease liabilities Total current liabilities Long-term liabilities: Debt Deferred revenue Income taxes payable Deferred income taxes Operating lease liabilities Other liabilities Total liabilities 312 S 1,736 4,733 54 97 6,932 306 1,422 3,629 63 92 5,512 4,123 145 534 s 453 252 12,444 4,117 130 529 10 499 223 11,020 Commitments and contingencies Stockholders' equity: Preferred stock, 80.0001 par value; 2 shares authorized: none issued Common stock, 50.0001 par value: 900 shares authorized; 601 shares issued; 475 and 479 shares outstanding, respectively Additional paid-in-capital Retained earnings Accumulated other comprehensive income (loss) Treasury stock, at cost (126 and 122 shares, respectively) Total stockholders' equity Total liabilities and stockholders' equity See accompanying Notes to Consolidated Financial Statements. 8,428 23,905 (137) (17,399) 14,797 27.241 S 7,357 19,611 (158) (13,546) 13,264 24,284
